WCapsuleM8
Premium report gallery

See the reports before you choose the tool.

Every PDF here is generated from a real CapsuleM8 premium tool using its built-in sample dataset. Open the report, inspect the charts and tables, then preview or get the tool that produced it.

PDF reports
97
Printable pages
232
Charts shown
388
Summary tables
194

A quick cross-section of board-level, operations, quality, project and supplier reporting outputs.

View premium tools
First page of the Balanced scorecard report PDF
CM8-232
Founders and Executives

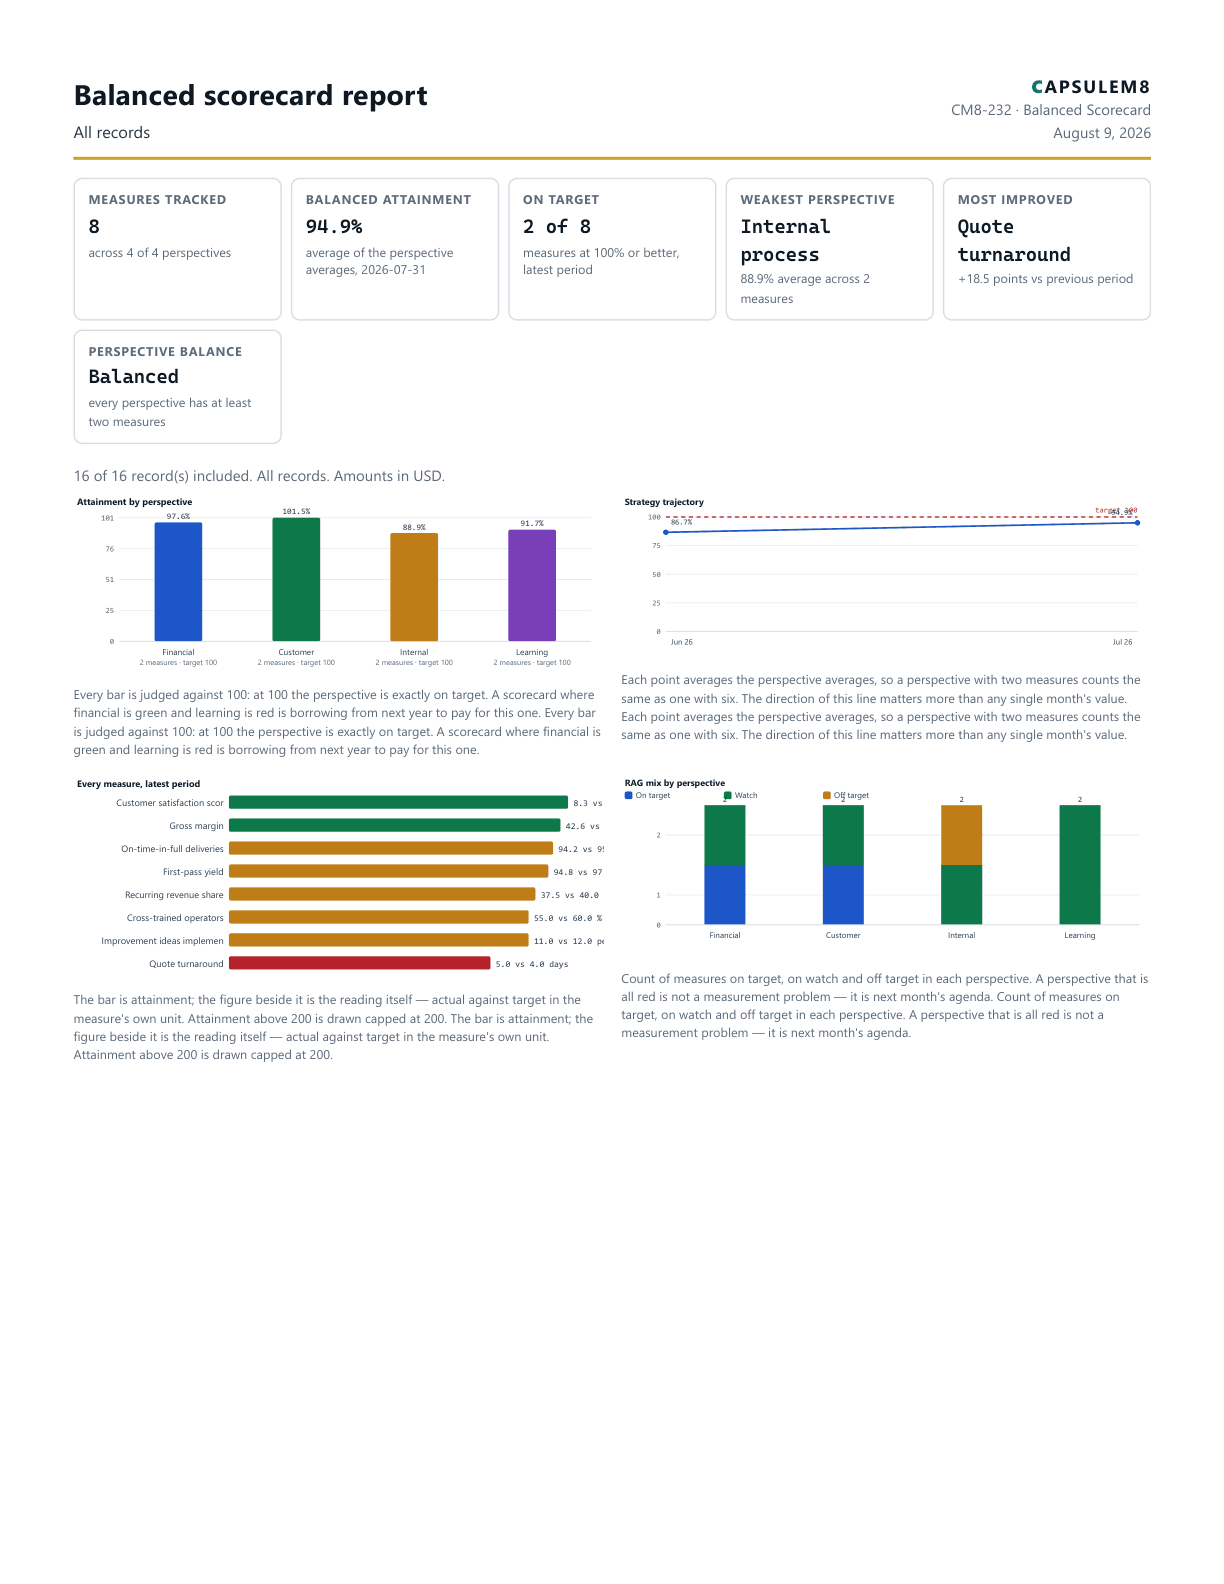
Balanced scorecard report

Balanced Scorecard

Run a four-perspective balanced scorecard — financial, customer, internal process and learning measures with direction-aware attainment, RAG status, a balance check and a board-ready report.

PDF 116 KB - v1.0 - reviewed 2026-08-06
First page of the Risk register report PDF
CM8-229
Governance and Risk

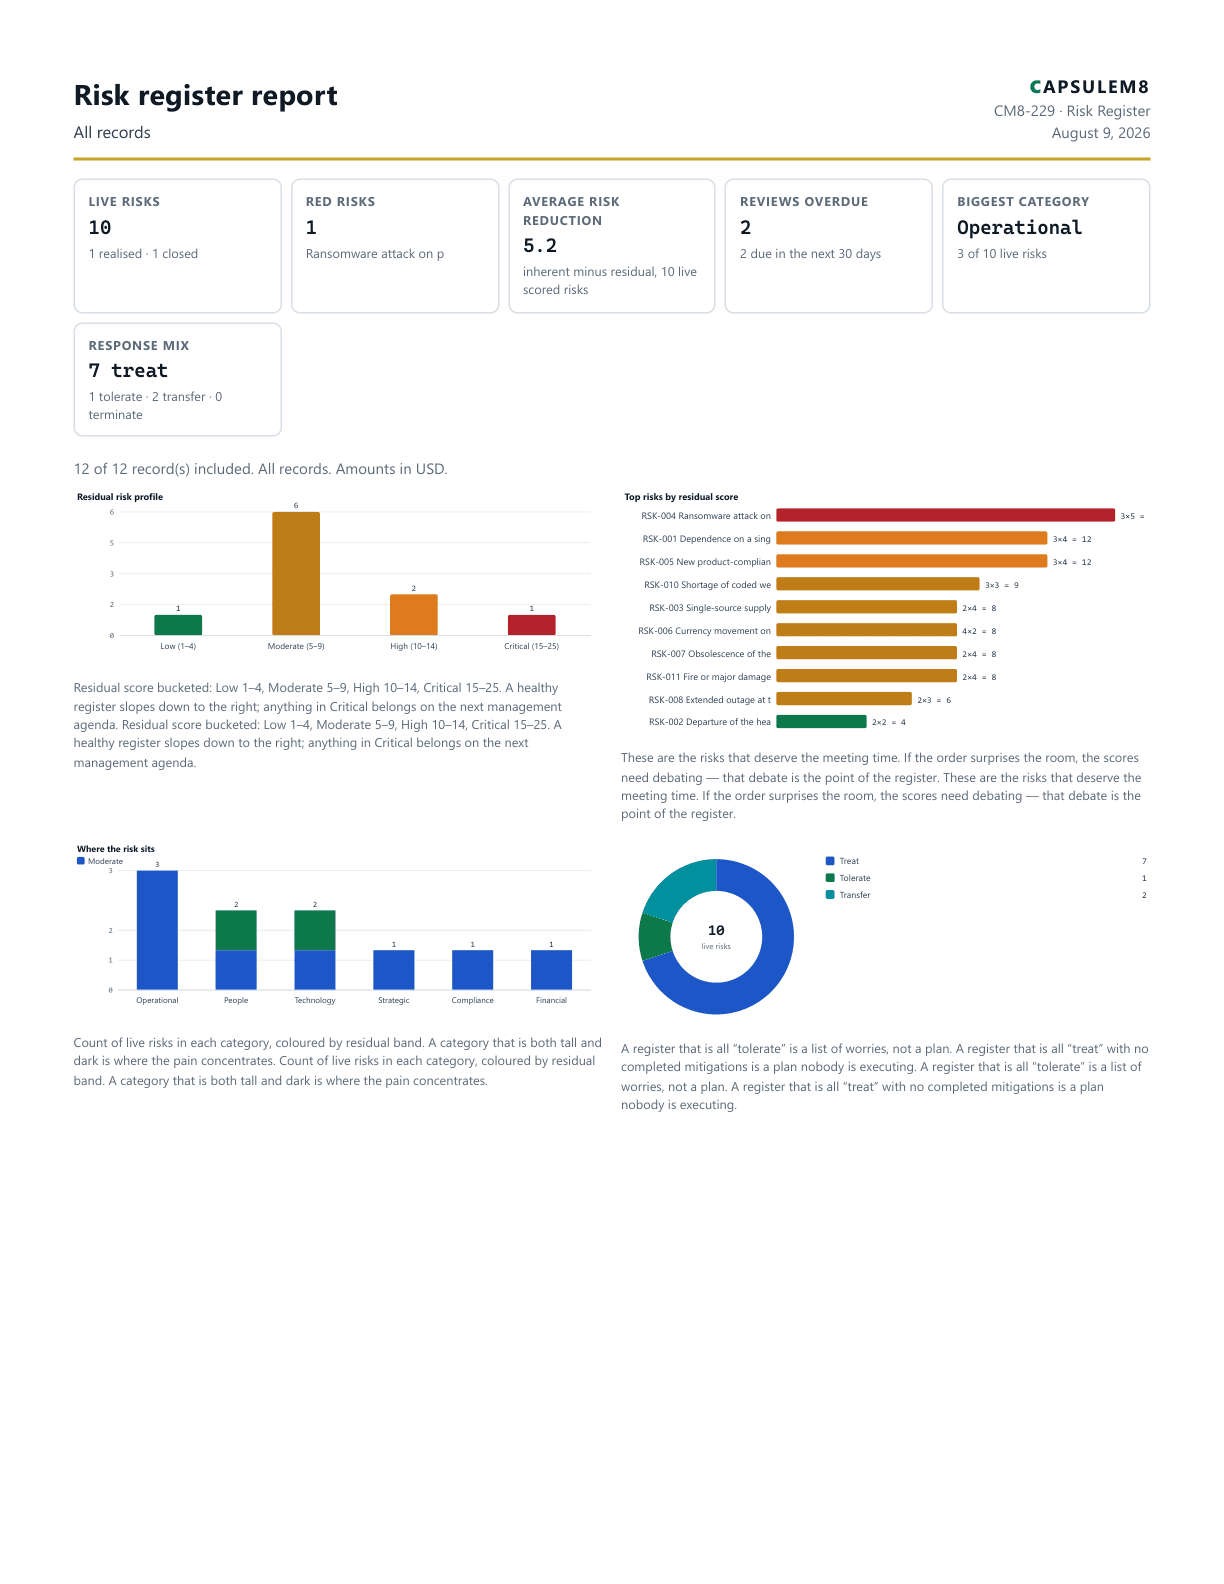
Risk register report

Risk Register

Keep a project and business risk register — strategic, financial, operational and compliance risks scored on a 5×5 grid, inherent and residual, with the four responses and a board-ready report. Not a workplace safety assessment.

PDF 97 KB - v1.0 - reviewed 2026-08-06

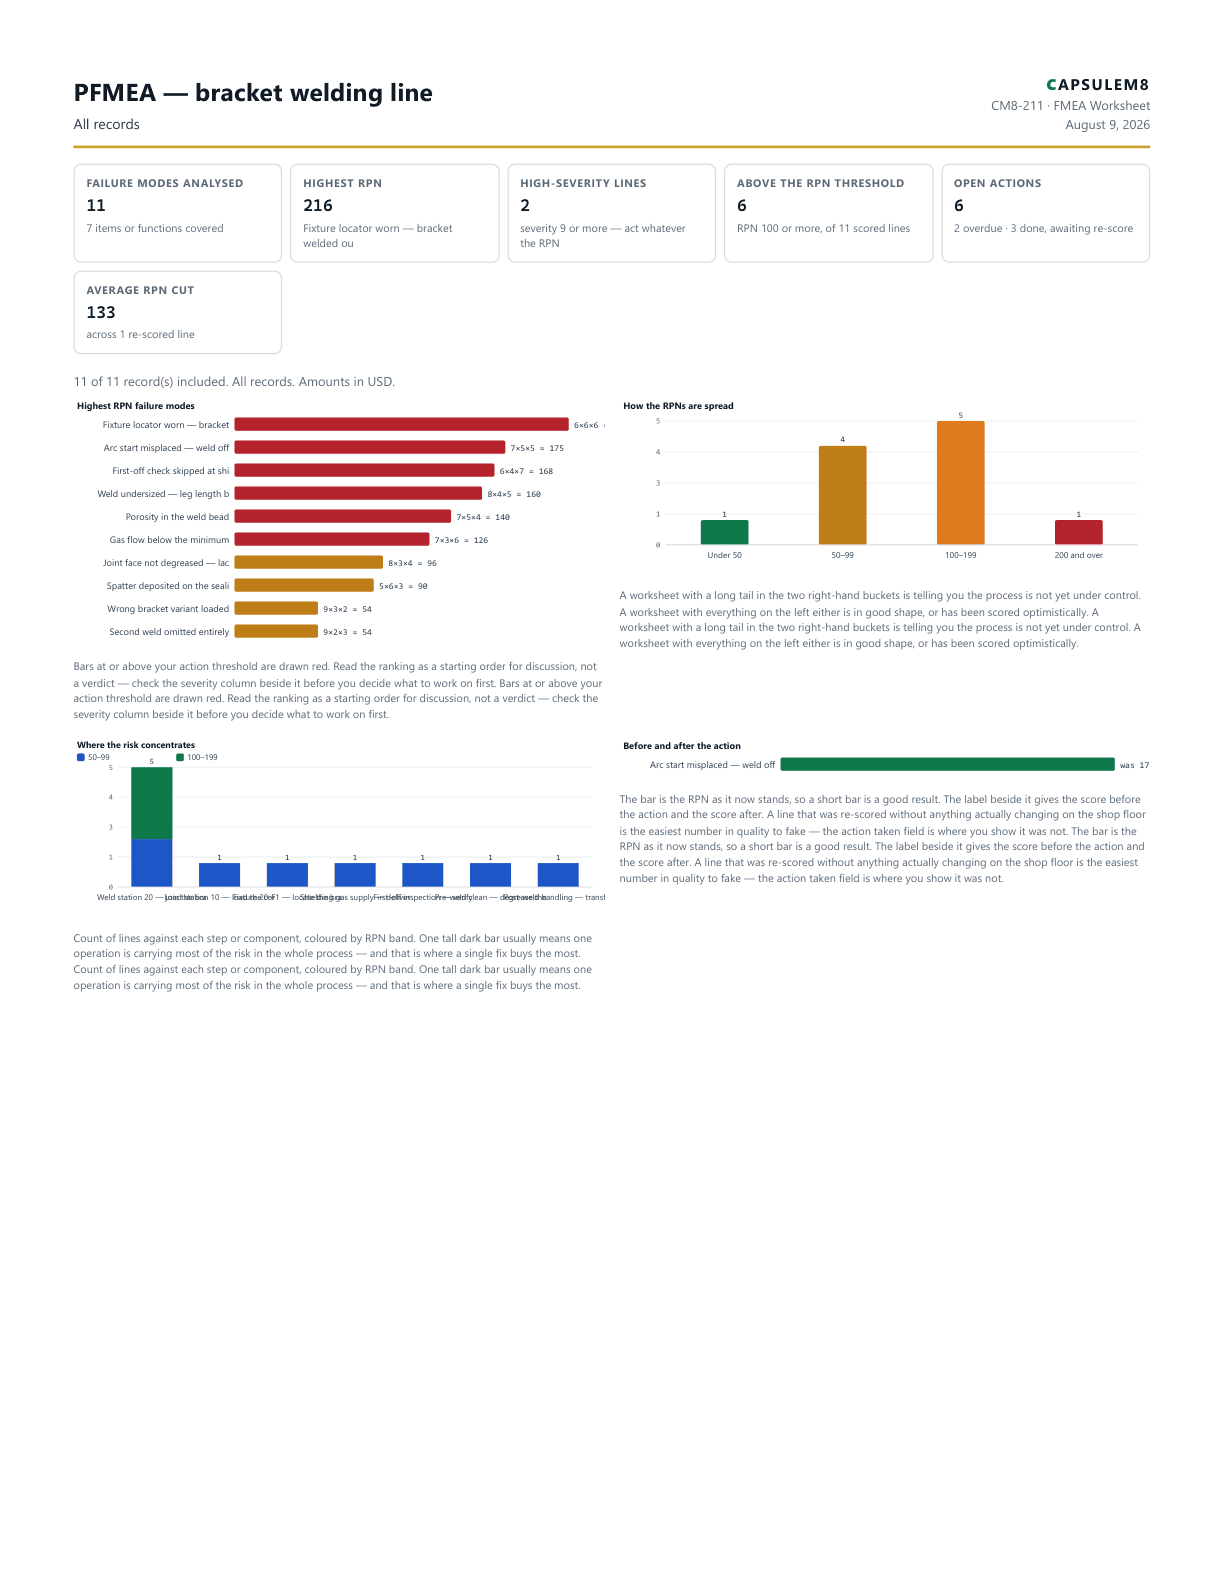
First page of the PFMEA — bracket welding line PDF
CM8-211
Manufacturing

PFMEA — bracket welding line

FMEA Worksheet

Build a PFMEA or DFMEA worksheet — failure modes, effects, severity, occurrence and detection, risk priority number, actions and an honest re-score after the fix, with a printable report. Runs entirely in your browser.

PDF 99 KB - v1.0 - reviewed 2026-08-07

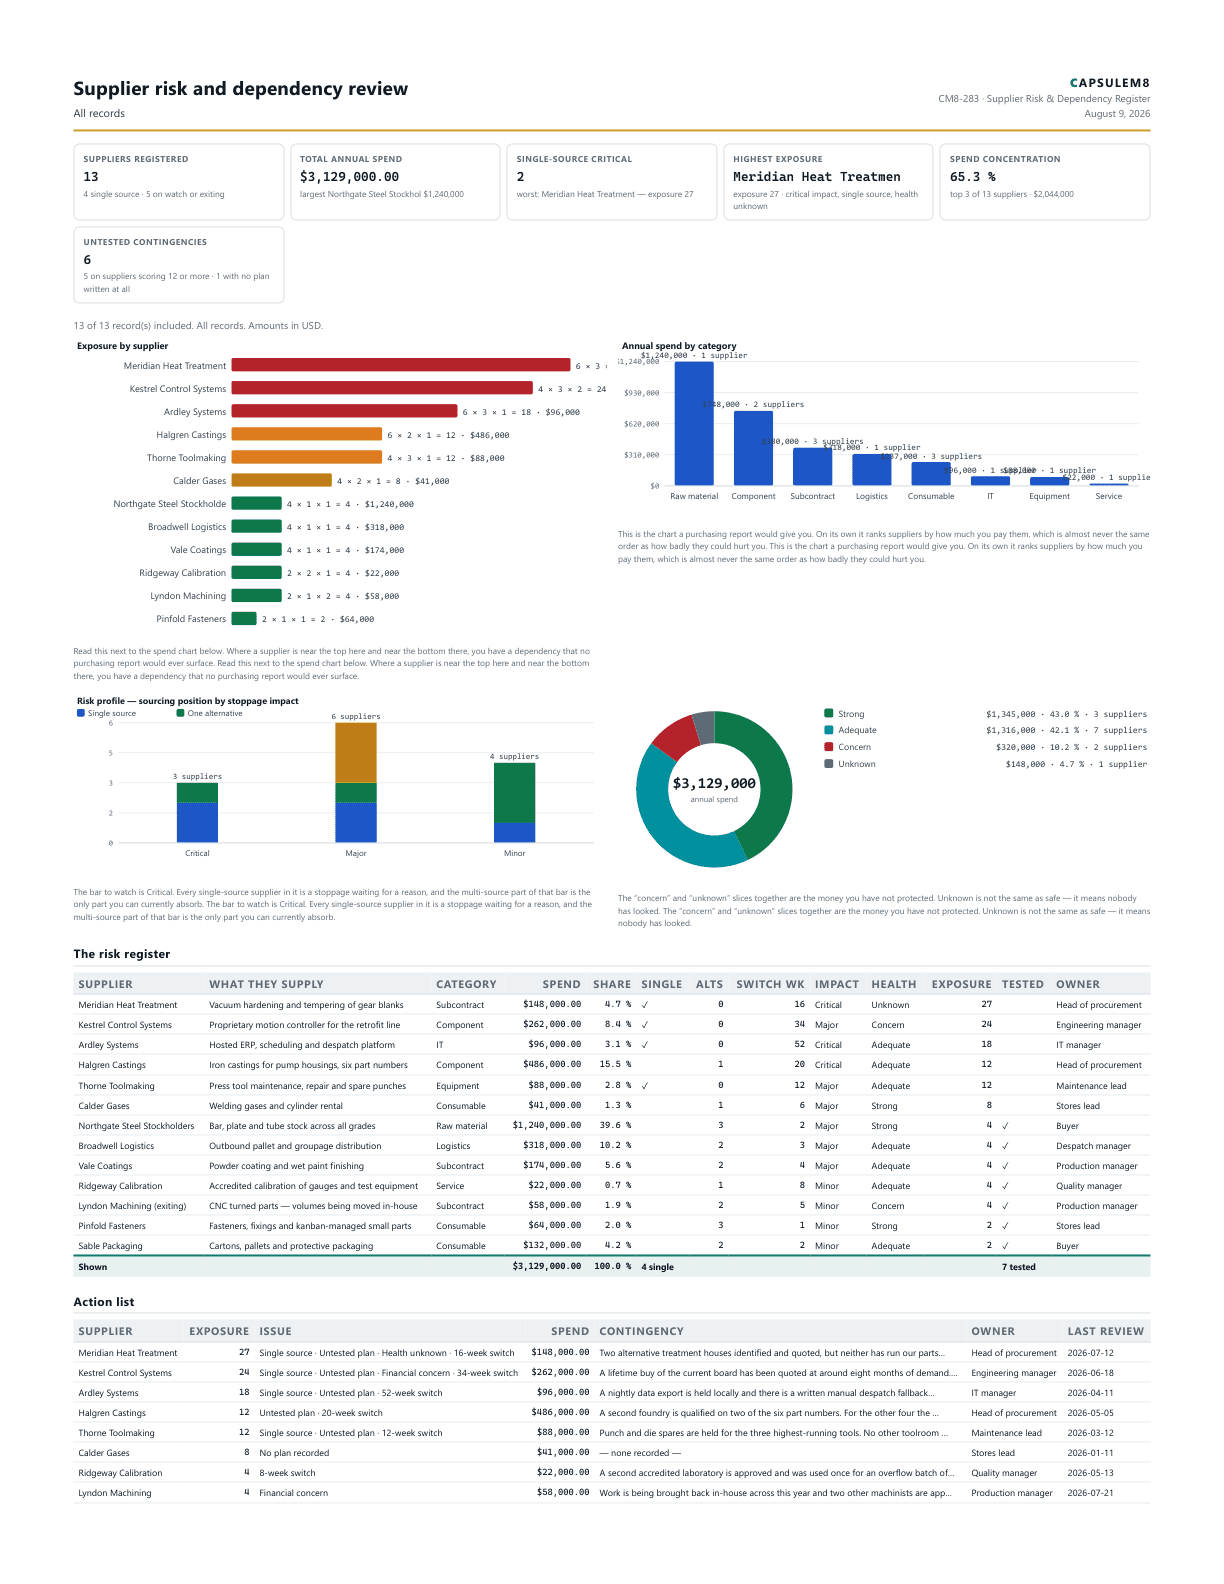
First page of the Supplier risk and dependency review PDF
CM8-283
Operations

Supplier risk and dependency review

Supplier Risk & Dependency Register

Map supply-chain dependency rather than spend: score every supplier for stoppage impact, sourcing position and financial health, expose single-source concentration, and list the suppliers with no tested contingency.

PDF 135 KB - v1.0 - reviewed 2026-08-07

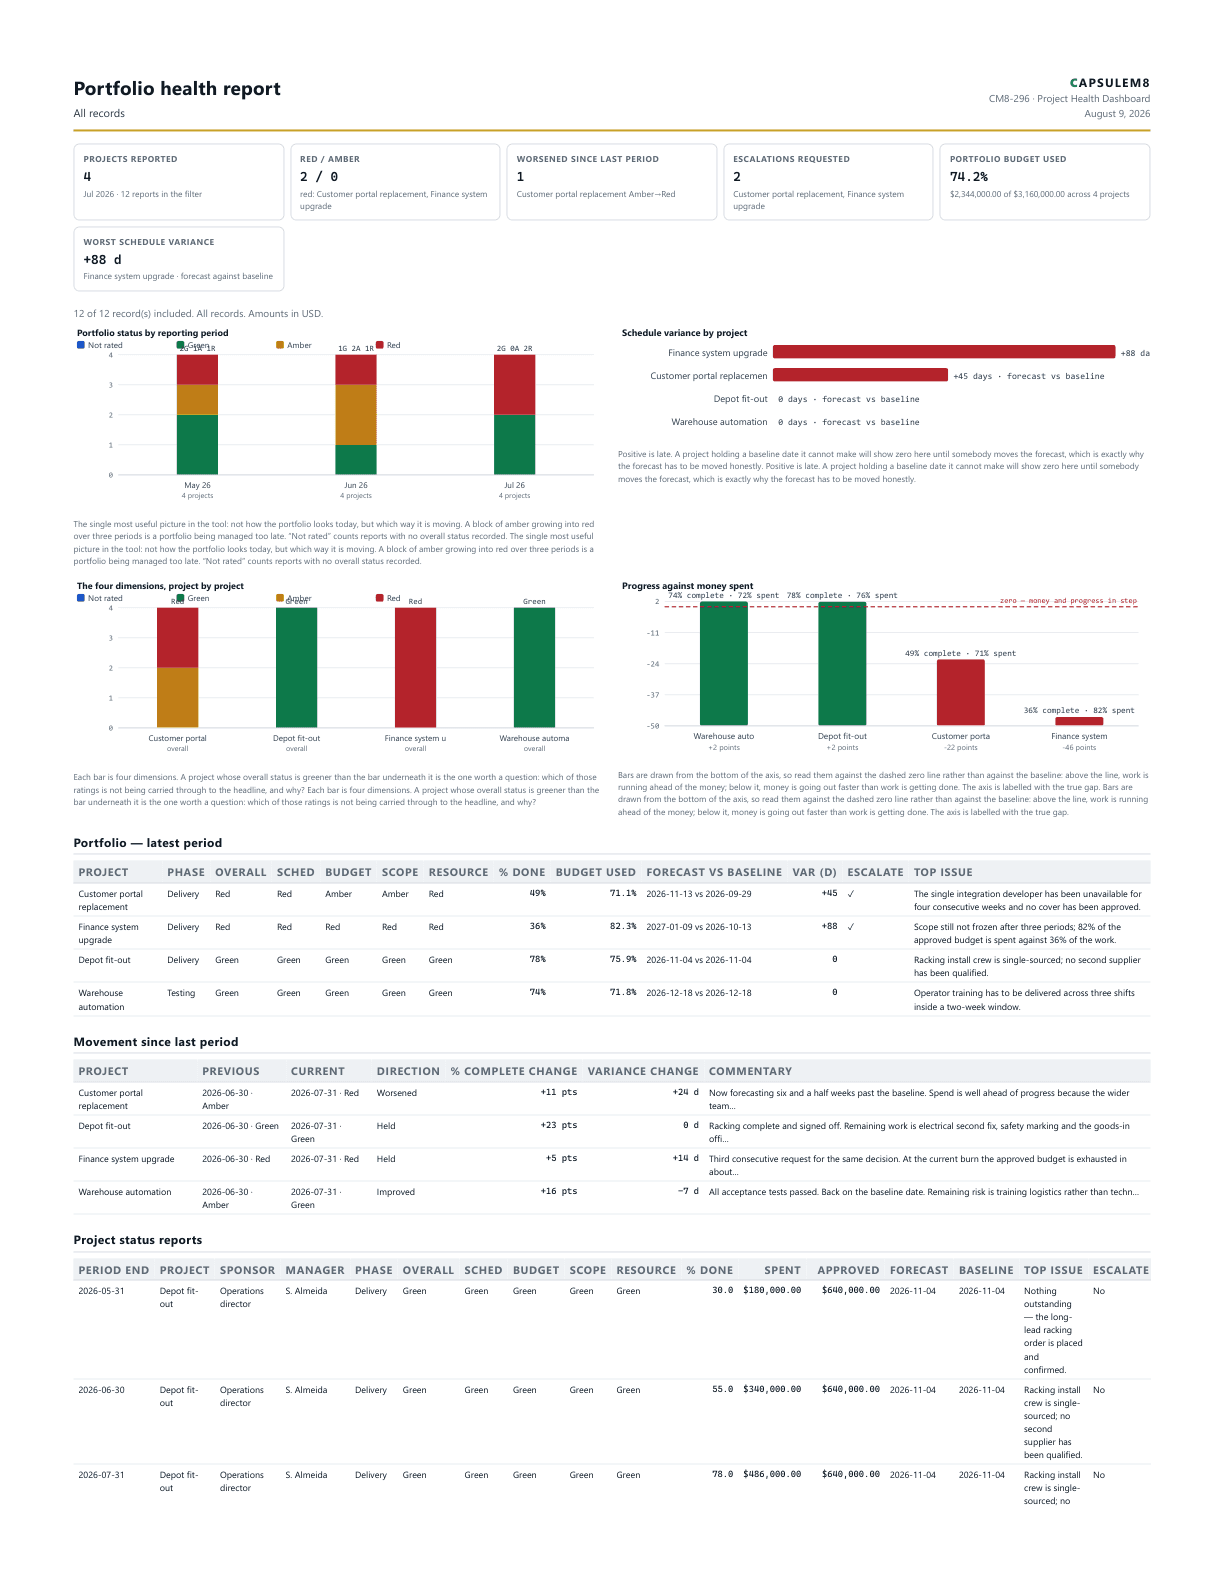
First page of the Portfolio health report PDF
CM8-296
Project Management

Portfolio health report

Project Health Dashboard

Report a portfolio of projects period by period — red, amber and green status across schedule, budget, scope and resource, spend against progress, forecast against baseline finish, and which projects worsened since last month. Runs entirely in your browser.

PDF 104 KB - v1.0 - reviewed 2026-08-07

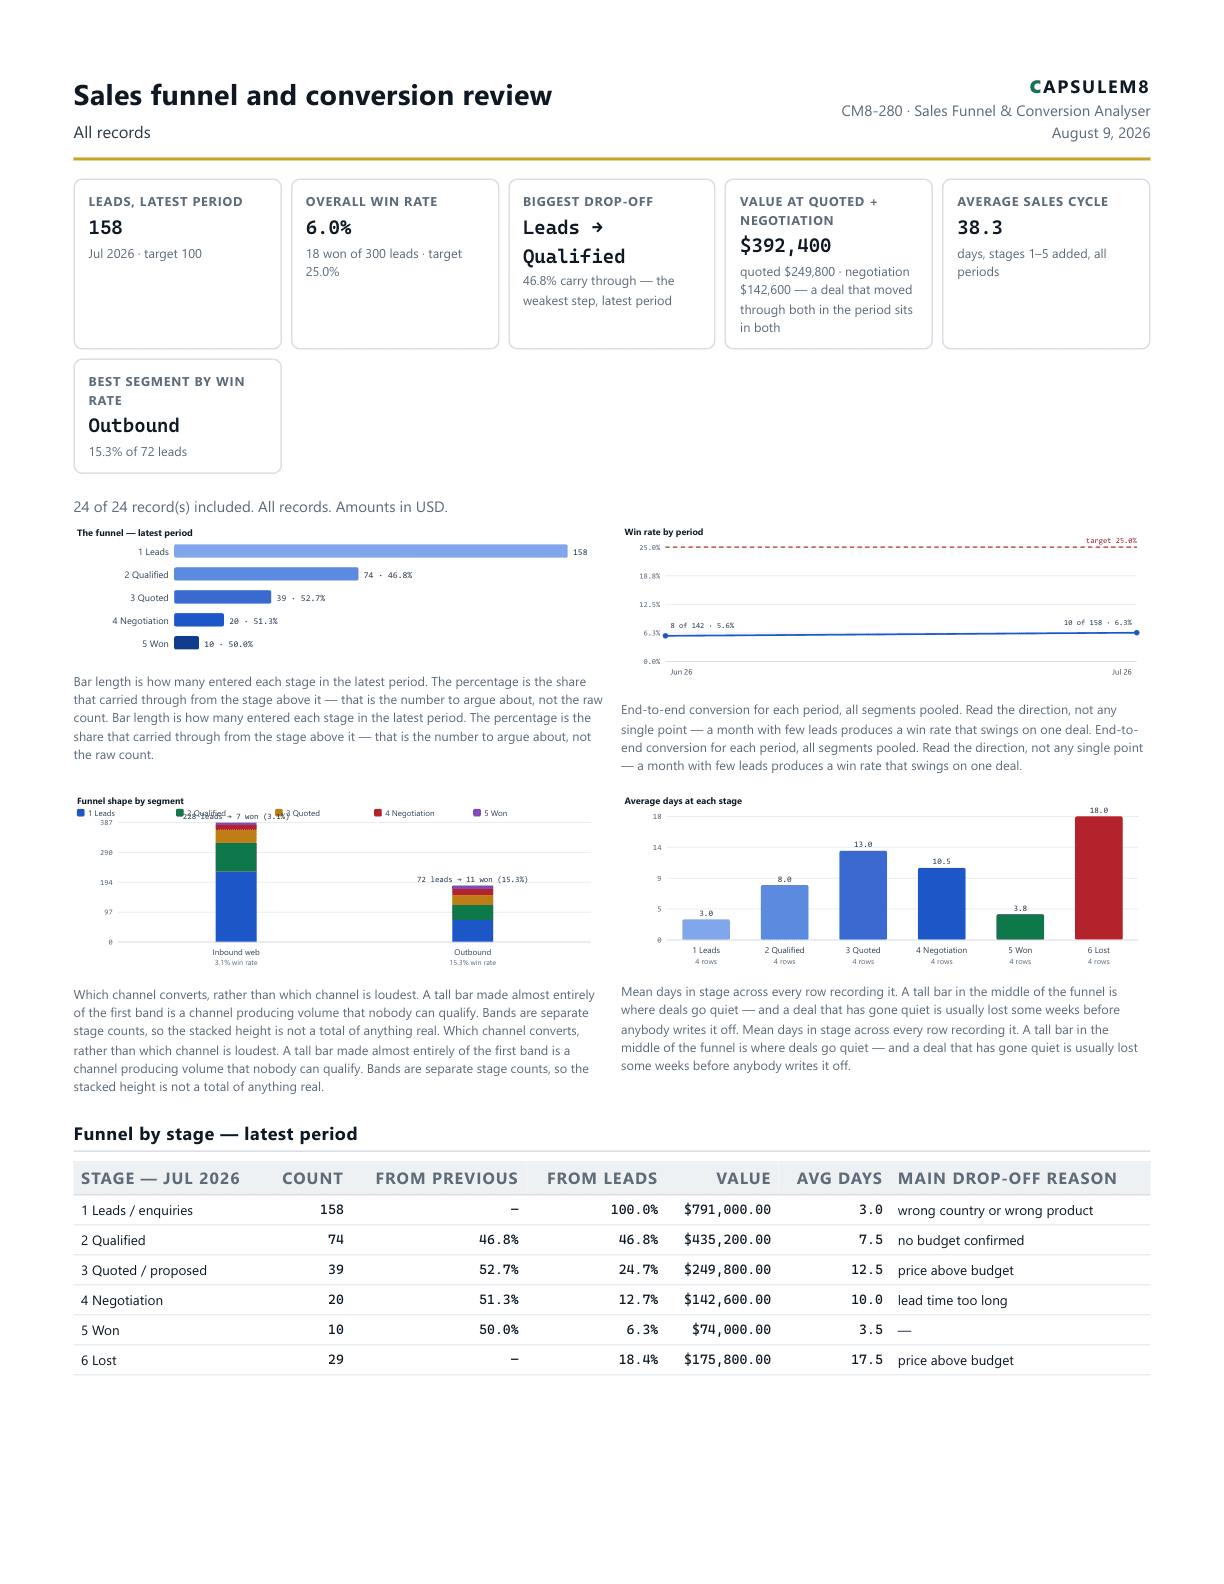
First page of the Sales funnel and conversion review PDF
CM8-280
Sales

Sales funnel and conversion review

Sales Funnel & Conversion Analyser

Measure stage-to-stage conversion in your sales funnel — where enquiries drop out, which channel actually converts, the average days deals sit at each stage, and how many leads a win target really needs. A funnel analyser, not an opportunity-by-opportunity pipeline list.

PDF 118 KB - v1.0 - reviewed 2026-08-07

What each report contains

The report is not a screenshot bolted onto a form. It is a printable management output: scope, summary, charts, tables, source rows, notes and the tool disclaimer in one PDF.

Executive summary

KPI tiles put the position on the first page: totals, exceptions, trends and the one number worth discussing.

Chart narrative

Charts include visible values and captions, so the report explains what changed rather than just drawing a picture.

Decision tables

The printed tables carry the ranked risks, open actions, overdue items or comparison rows that make the report auditable.

Professional metadata

The PDF title, subject, author, keywords, creator and review date are stamped from the tool specification.

How to read these samples

At a high level, look at the first row of tiles, then the first chart. That tells you whether the tool produces the kind of management conversation you need: risk, capacity, cost, delivery, compliance, quality or performance.

At detail level, inspect the tables and notes. Each sample report uses realistic rows from the tool specification, keeps the source register in the printed output where it matters, and includes the report scope so filtered and unfiltered numbers are not confused.

All report examples

27 of 97 report PDFs shown in Manufacturing.

First page of the 5 Why root cause analysis report PDF
CM8-226
Manufacturing

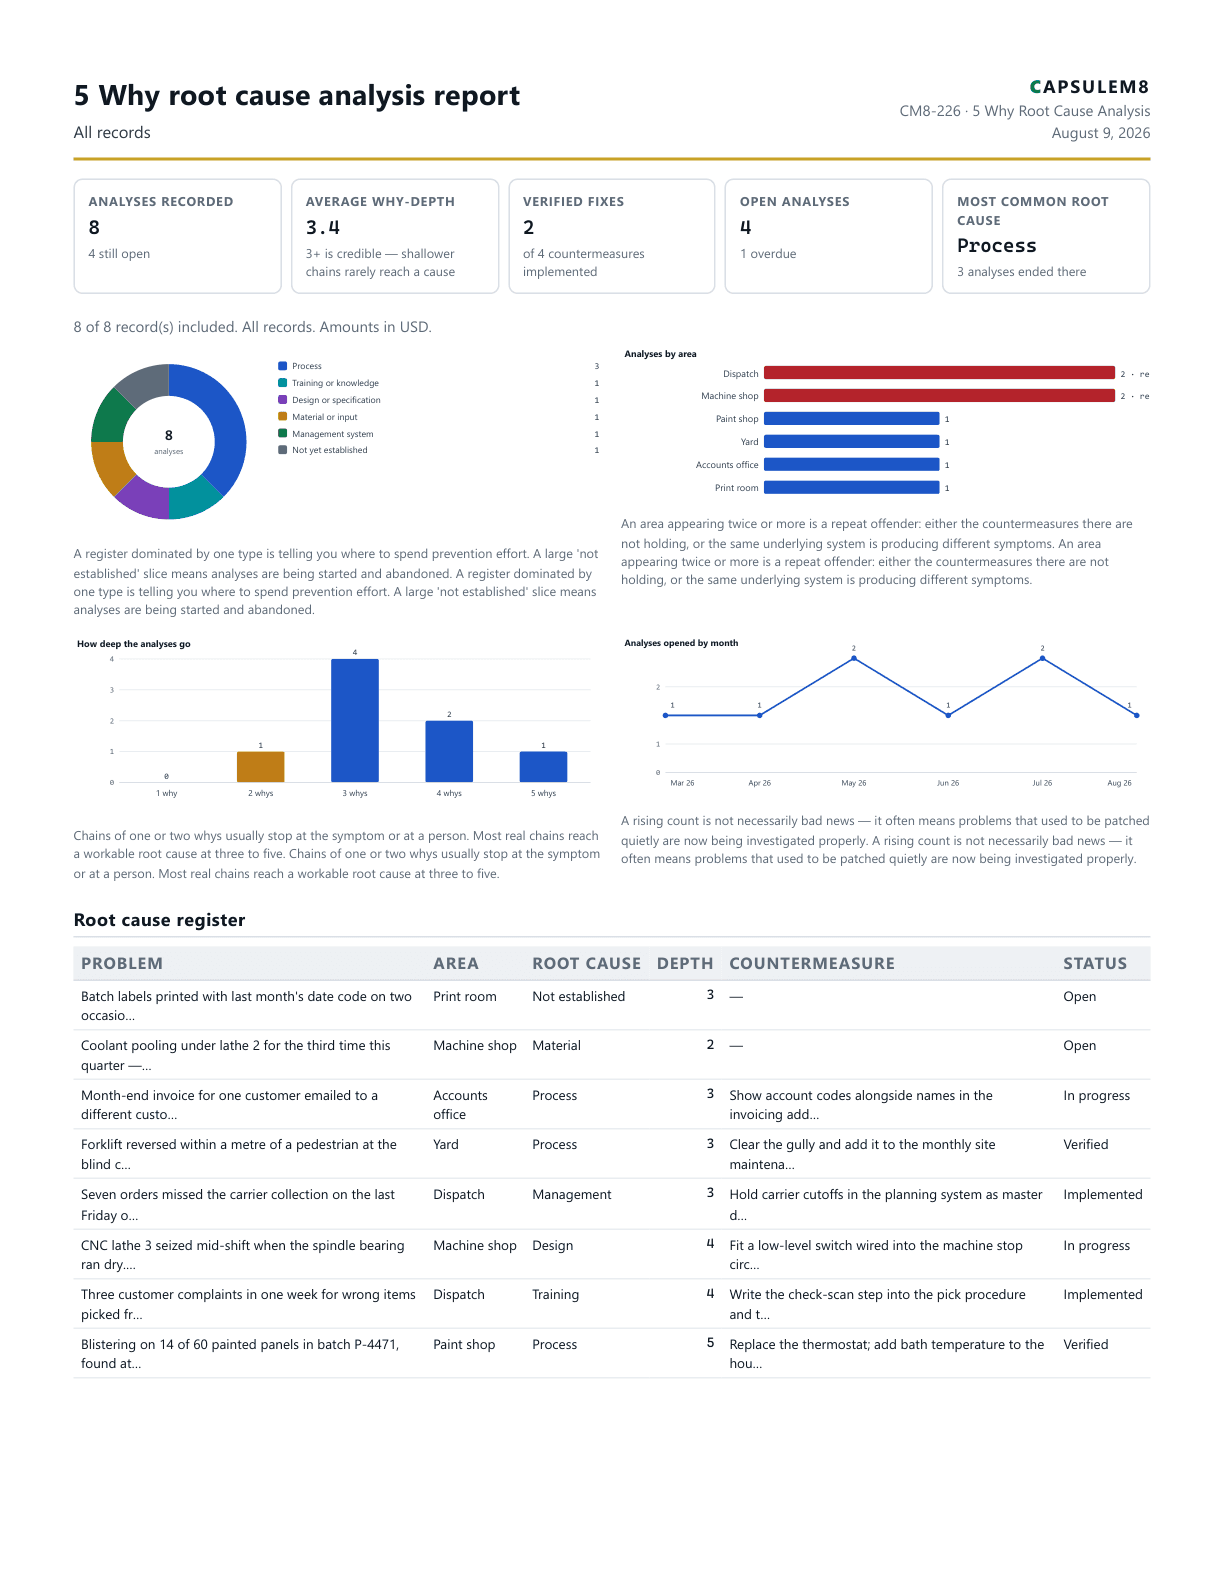
5 Why root cause analysis report

5 Why Root Cause Analysis

Run 5 Why root cause analyses: state the problem, walk the why chain, name the root cause, then track the countermeasure through to verified. Runs entirely in your browser —

Report detail

Sample analyses — replace every entry with your own before circulating this report or acting on it.

Records
8
Pages
2
Charts
4
Tables
2

Charts: Where the chains end, Analyses by area, How deep the analyses go...

Tables: Root cause register, Open and unverified

PDF 99 KB - v1.0 - reviewed 2026-08-06

First page of the 5S audit report PDF
CM8-260
Manufacturing

5S audit report

5S Audit

Run a 5S workplace audit — score Sort, Set in order, Shine, Standardise and Sustain checkpoint by checkpoint from 0 to 4, track the audit score over time, and turn every low score into a corrective action with an owner and a date.

Report detail

Sample audit — replace every score with your own observations before relying on it or circulating it.

Records
10
Pages
3
Charts
4
Tables
2

Charts: Average score per S — latest audit, Audit score over time, Lowest-scoring checkpoints — latest audit...

Tables: Latest audit detail, Open 5S actions

PDF 103 KB - v1.0 - reviewed 2026-08-06

First page of the 8D problem-solving report PDF
CM8-212
Manufacturing

8D problem-solving report

8D Problem Solving Record

Run 8D problem-solving reports discipline by discipline — team, containment, verified root cause, corrective action, prevention — with a board that shows exactly where each report is stuck.

Report detail

Sample reports — replace every entry with your own before relying on this or circulating it.

Records
12
Pages
3
Charts
4
Tables
2

Charts: The 8D board, Reports by days open, Discipline status mix...

Tables: Report detail, All reports at a glance

PDF 92 KB - v1.0 - reviewed 2026-08-06

First page of the Product quality planning — programme status PDF
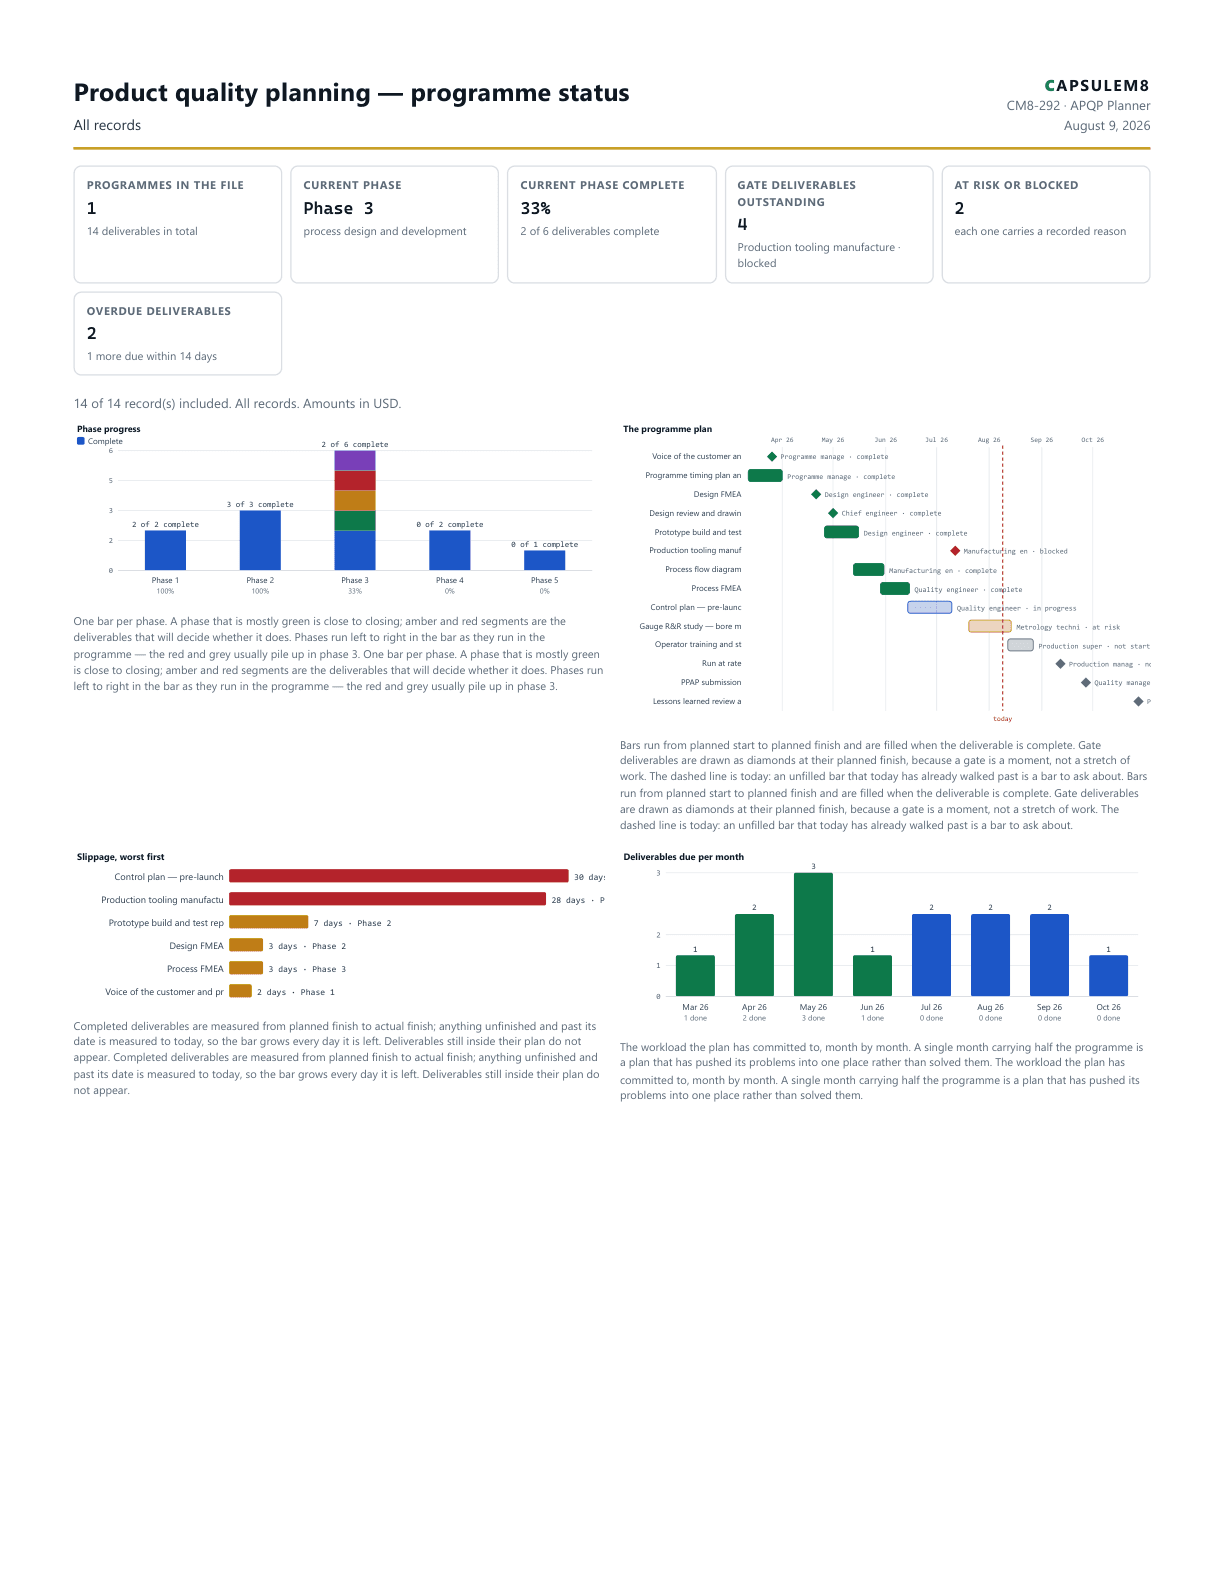
CM8-292
Manufacturing

Product quality planning — programme status

APQP Planner

Plan a product launch across the five quality-planning phases — one row per deliverable, with owners, planned and actual dates, gate deliverables, risk notes, phase completion and a Gantt of the whole programme.

Report detail

Sample programme — replace every deliverable with your own before circulating it.

Records
14
Pages
3
Charts
4
Tables
2

Charts: Phase progress, The programme plan, Slippage, worst first...

Tables: Programme plan, Gate status

PDF 114 KB - v1.0 - reviewed 2026-08-07

First page of the Bottleneck analysis — hydraulic manifold cell PDF
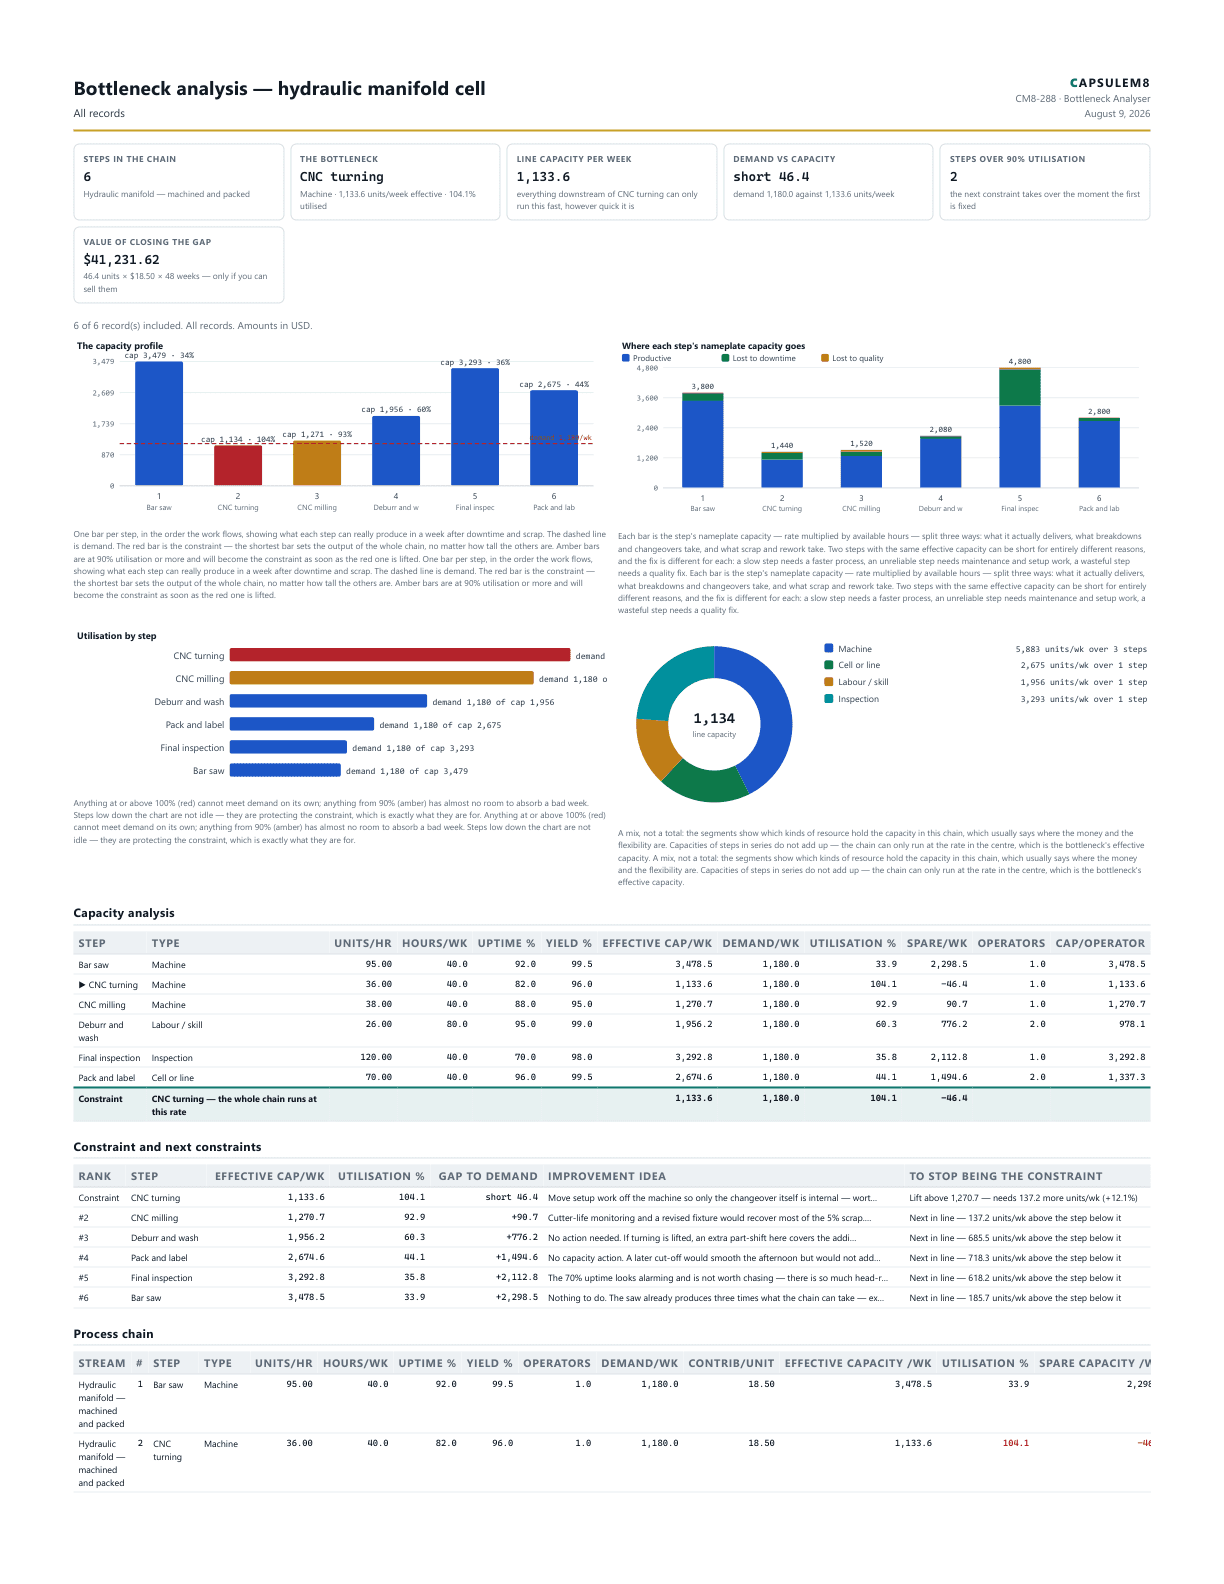
CM8-288
Manufacturing

Bottleneck analysis — hydraulic manifold cell

Bottleneck Analyser

Find the real constraint in a process chain by effective capacity — rate, uptime and yield combined — then size the utilisation, the near-constraints and what closing the demand gap is worth.

Report detail

Sample chain built from one week of observed rates, downtime and scrap. Replace every step with your own measured figures before relying on it or circulating it. The turning cell is the constraint on these numbers; re-run the analysis after the setup and jaw-change work, because the constraint is expected to move to milling.

Records
6
Pages
2
Charts
4
Tables
2

Charts: The capacity profile, Where each step's nameplate capacity goes, Utilisation by step...

Tables: Capacity analysis, Constraint and next constraints

PDF 126 KB - v1.0 - reviewed 2026-08-07

First page of the Changeover performance report PDF
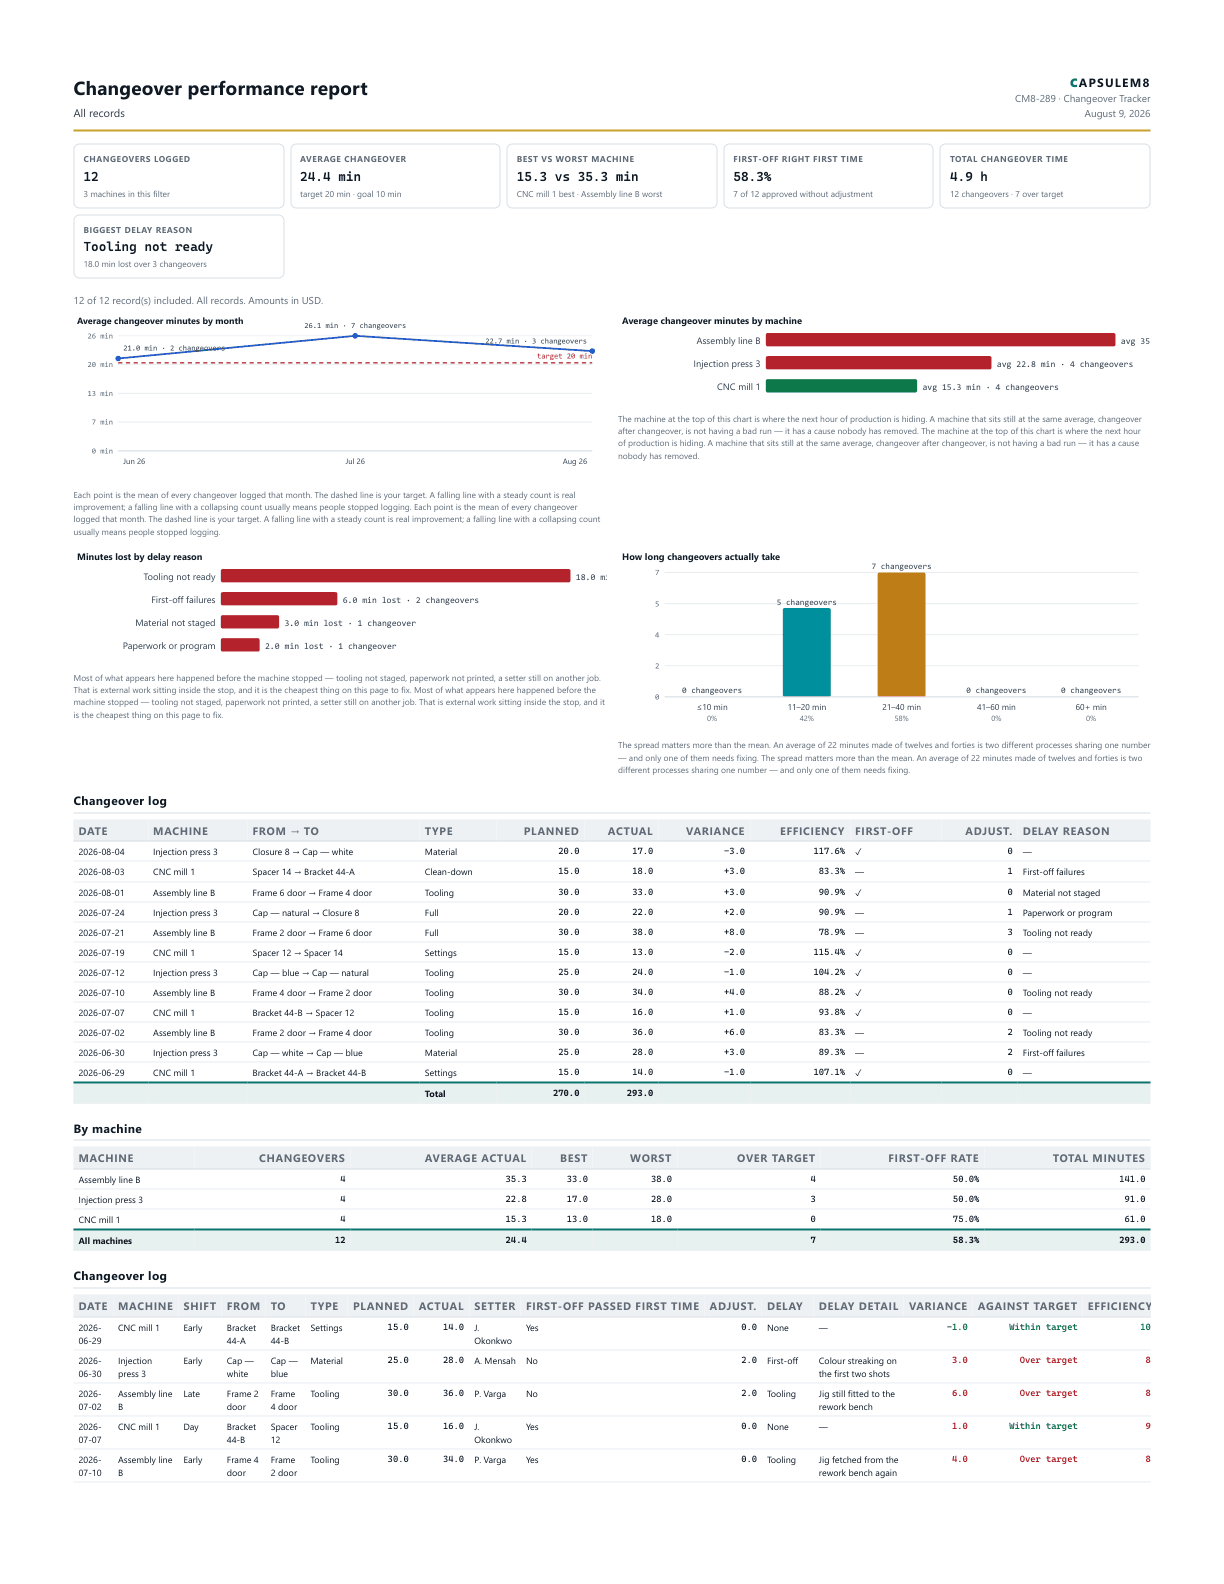
CM8-289
Manufacturing

Changeover performance report

Changeover Tracker

Log every changeover with its planned and actual minutes, see the trend against your target, find the machines and delay reasons that keep costing you downtime, and prove the improvement. Runs entirely in your browser —

Report detail

Sample log covering six weeks across three machines. Assembly line B has lost time to tooling that is not staged in three of its four changeovers — that is the action, not a faster setter. Replace every entry with your own before circulating this.

Records
12
Pages
2
Charts
4
Tables
2

Charts: Average changeover minutes by month, Average changeover minutes by machine, Minutes lost by delay reason...

Tables: Changeover log, By machine

PDF 116 KB - v1.0 - reviewed 2026-08-07

First page of the Process control plan PDF
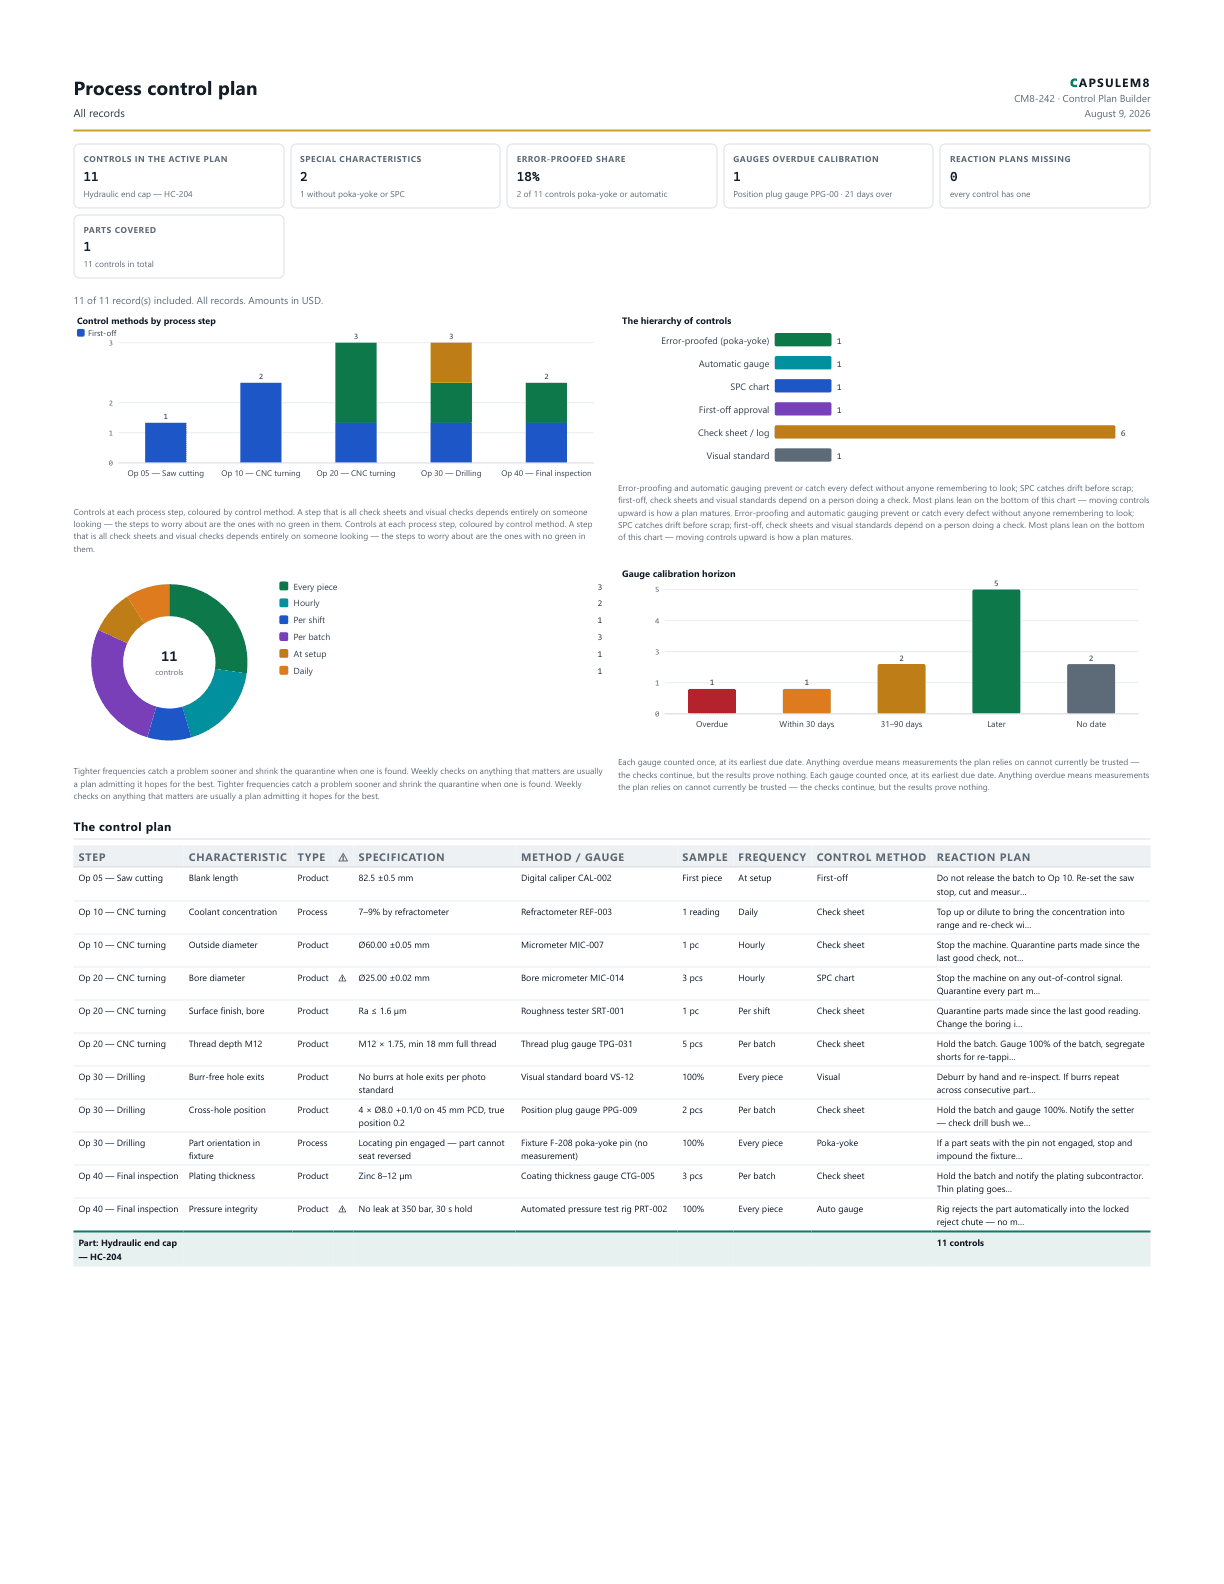
CM8-242
Manufacturing

Process control plan

Control Plan Builder

Build an APQP-style process control plan — every characteristic with its specification, gauge, sample size, check frequency, control method and reaction plan, plus gauge-calibration tracking and a print-ready plan.

Report detail

Sample plan — replace every control with your own before releasing it or showing it to a customer.

Records
11
Pages
2
Charts
4
Tables
2

Charts: Control methods by process step, The hierarchy of controls, Check frequency mix...

Tables: The control plan, Gauge calibration schedule

PDF 113 KB - v1.0 - reviewed 2026-08-06

First page of the Daily production board — Assembly line 2, early shift PDF
CM8-247
Manufacturing

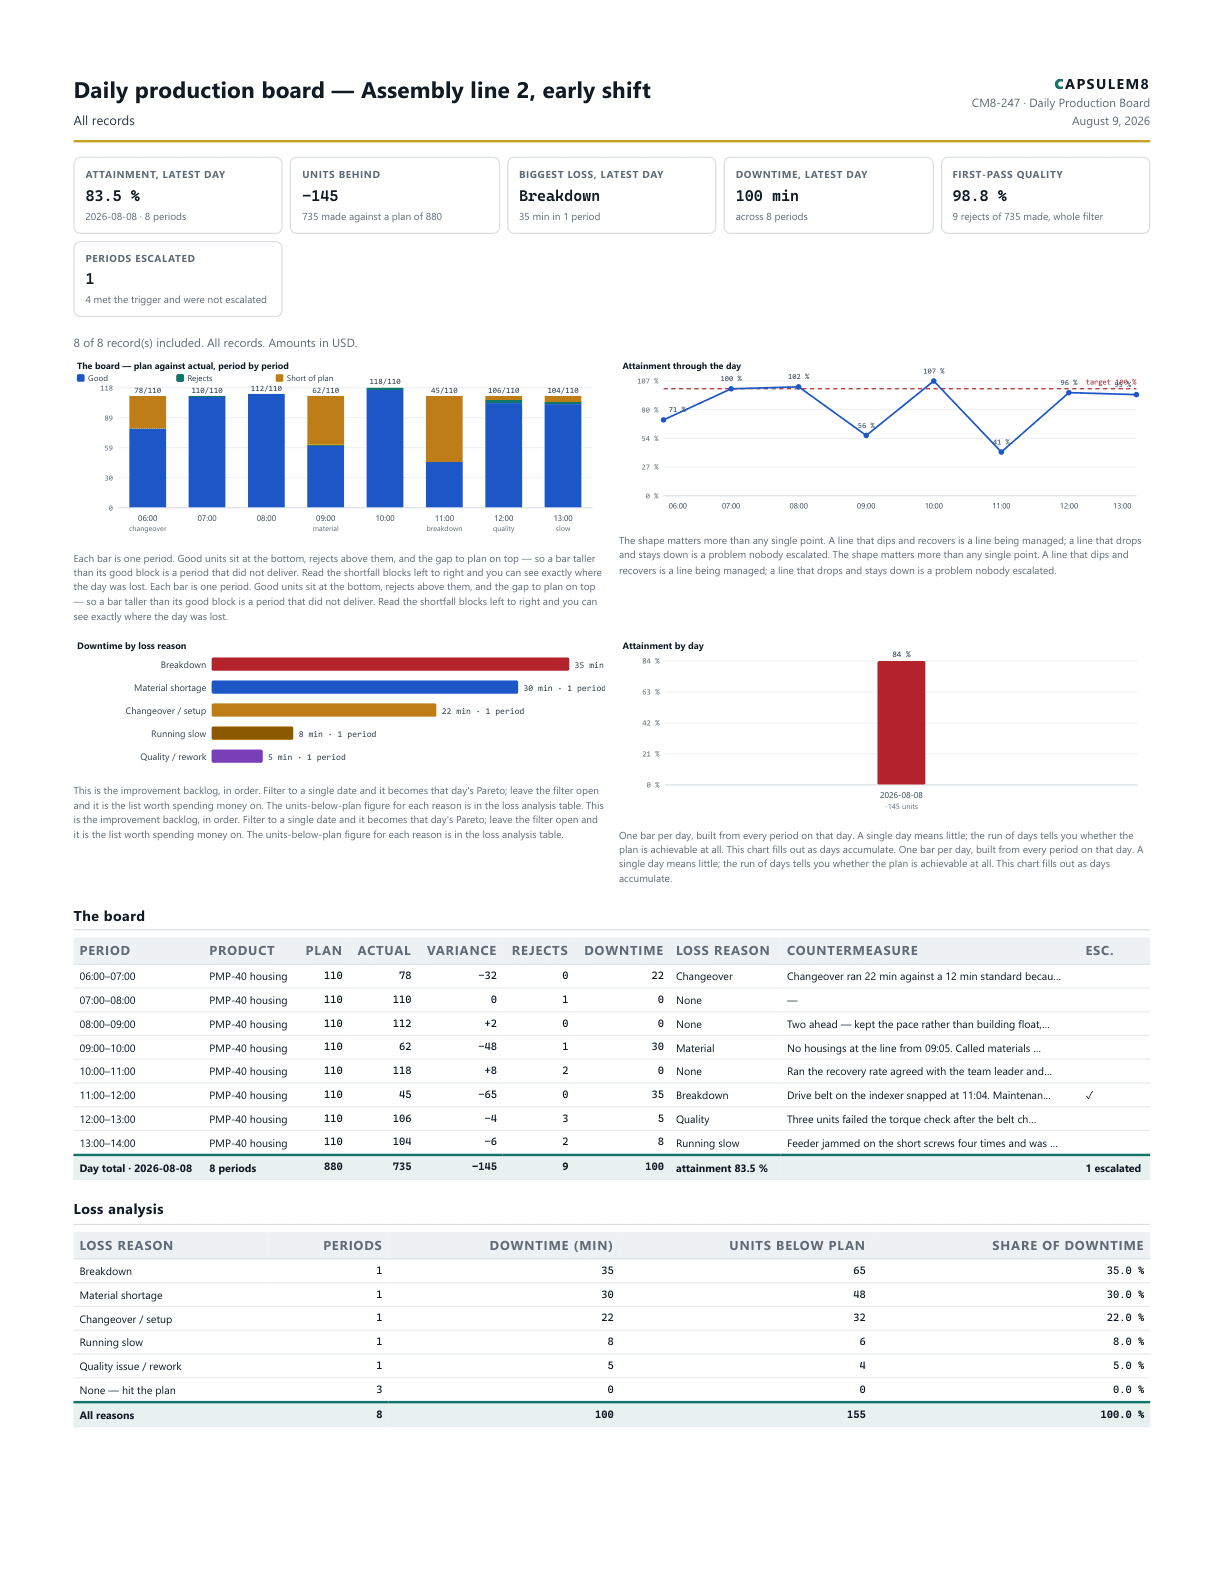
Daily production board — Assembly line 2, early shift

Daily Production Board

Run an hour-by-hour production board — plan against actual for every period, the loss reason and countermeasure written in the hour it happened, attainment, first-pass quality and a downtime Pareto, printed for the shift handover.

Report detail

Sample shift — replace every period with your own before relying on it or circulating it. The day finished 145 units behind an 880-unit plan on 100 minutes of downtime; the belt failure at 11:00 took a third of the lost minutes and the largest single bite out of output, and the material call-off at 09:00 took the next. Belt spare now held at the line and the kanban trigger moved to two bins — both to be checked at tomorrow's board.

Records
8
Pages
2
Charts
4
Tables
2

Charts: The board — plan against actual, period by period, Attainment through the day, Downtime by loss reason...

Tables: The board, Loss analysis

PDF 116 KB - v1.0 - reviewed 2026-08-07

First page of the Fishbone analysis — coating thickness PDF
CM8-227
Manufacturing

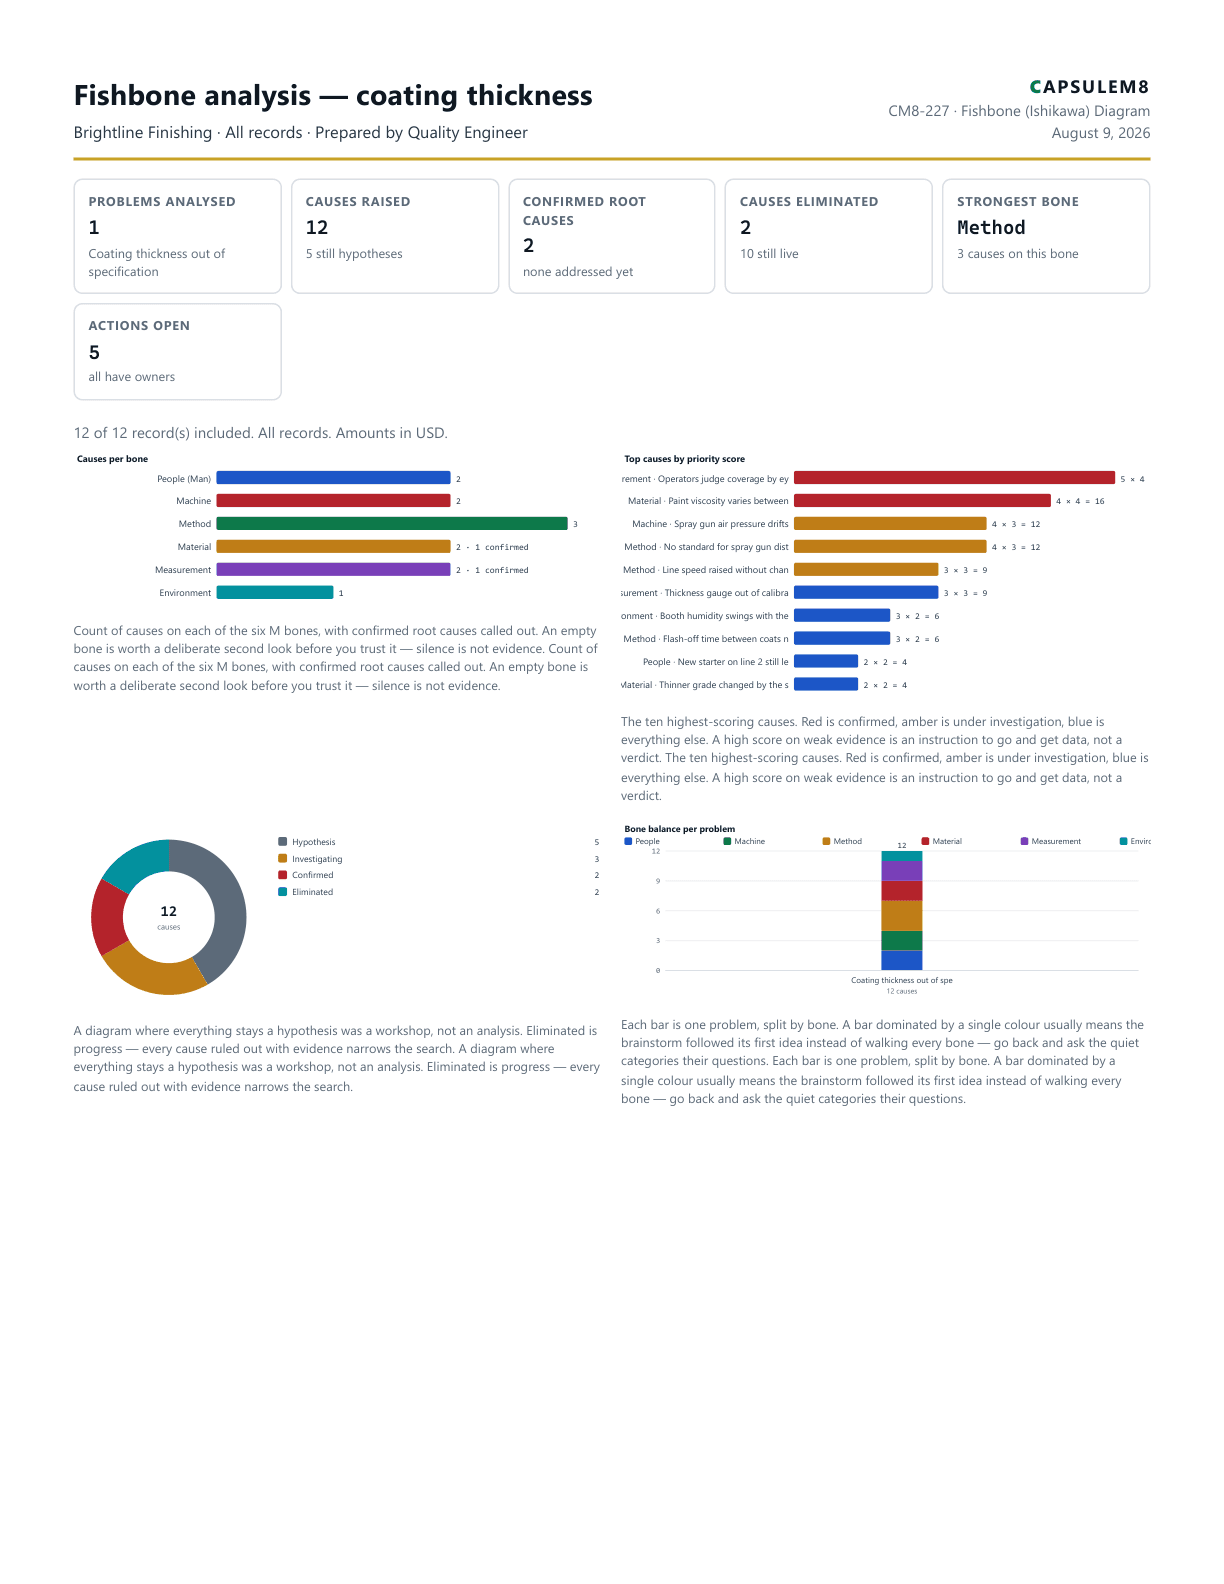
Fishbone analysis — coating thickness

Fishbone (Ishikawa) Diagram

Build a fishbone (Ishikawa) cause-and-effect diagram as a working register — causes on the six M bones, scored by likelihood and evidence, verified root causes tracked to action, printed as an investigation-ready report.

Report detail

Sample analysis for a coating line — replace every problem, cause, score and action with your own before circulating or acting on it.

Records
12
Pages
3
Charts
4
Tables
2

Charts: Causes per bone, Top causes by priority score, Causes by status...

Tables: The diagram, bone by bone, Confirmed root causes and actions

PDF 96 KB - v1.0 - reviewed 2026-08-06
First page of the PFMEA — bracket welding line PDF
CM8-211
Manufacturing

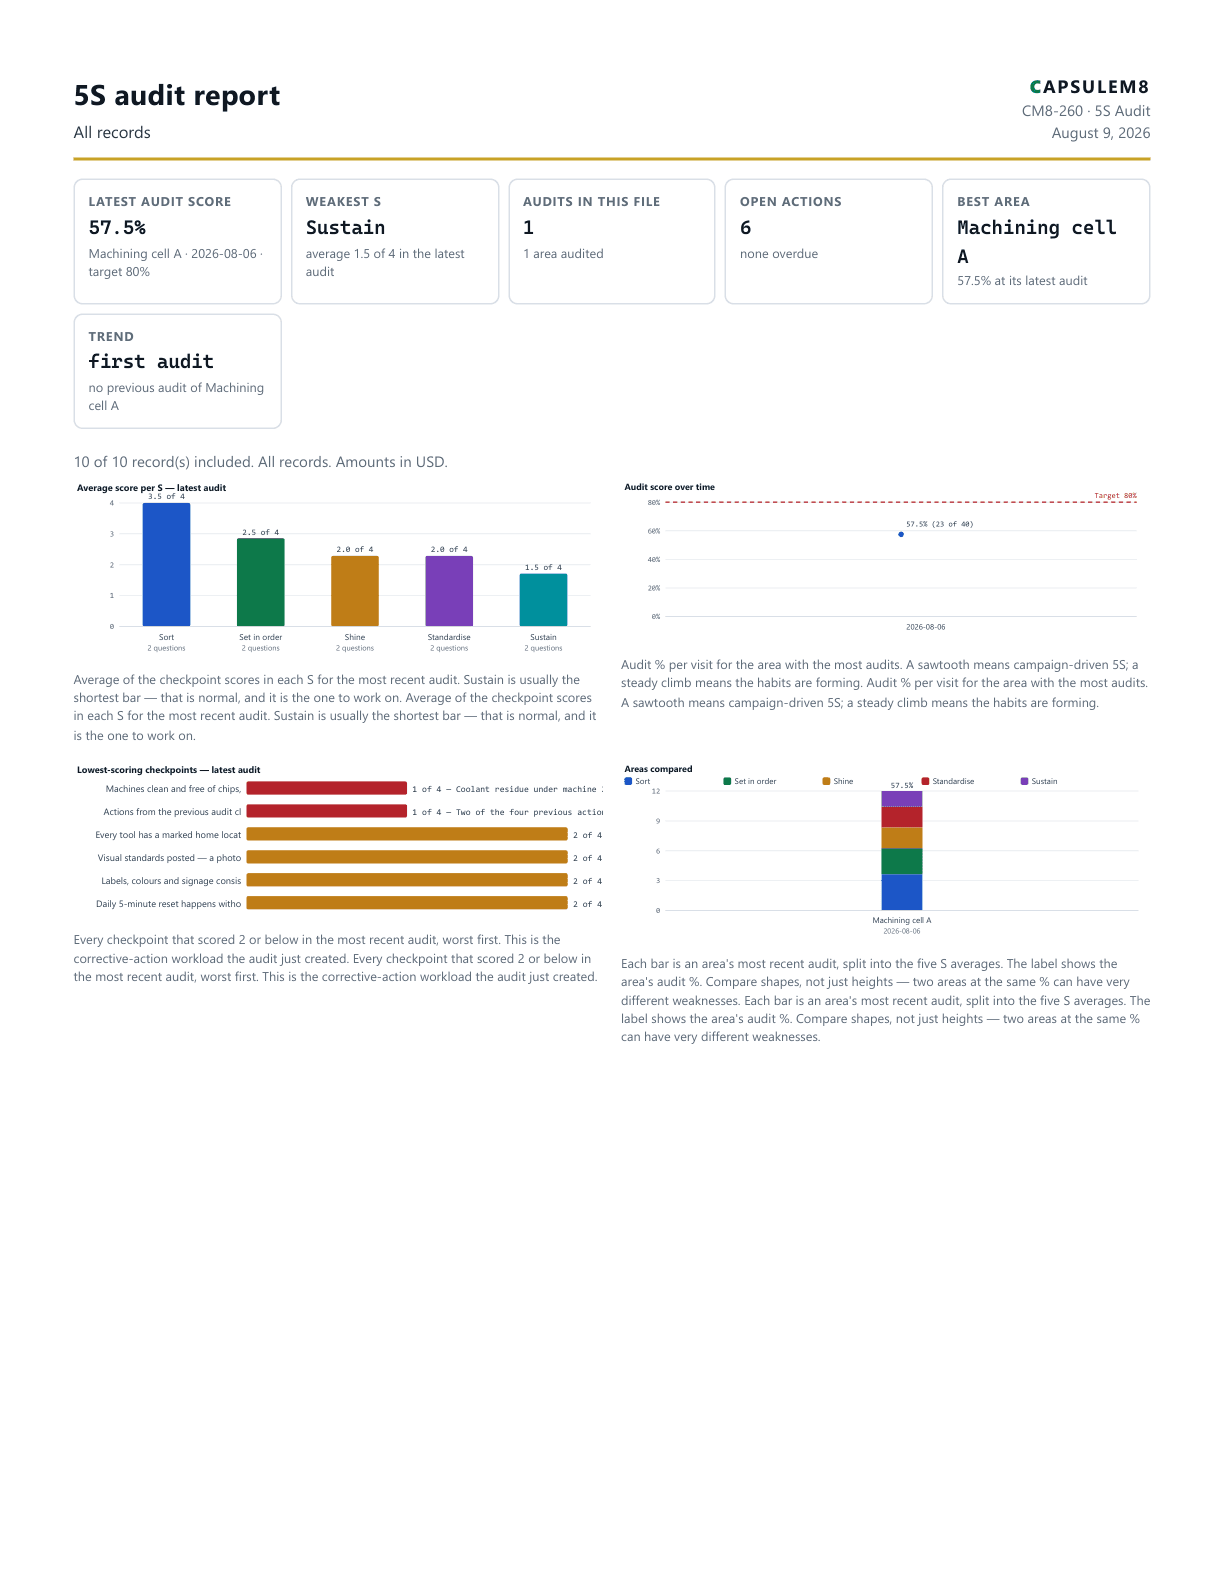
PFMEA — bracket welding line

FMEA Worksheet

Build a PFMEA or DFMEA worksheet — failure modes, effects, severity, occurrence and detection, risk priority number, actions and an honest re-score after the fix, with a printable report. Runs entirely in your browser.

Report detail

Sample worksheet — replace every line with your own before relying on it or circulating it. Scores here are illustrative and were not produced by a real cross-functional team.

Records
11
Pages
5
Charts
4
Tables
2

Charts: Highest RPN failure modes, How the RPNs are spread, Where the risk concentrates...

Tables: The FMEA worksheet, Action priority

PDF 99 KB - v1.0 - reviewed 2026-08-07

First page of the Gauge R&R study — bore micrometer MIC-014 PDF
CM8-210
Manufacturing

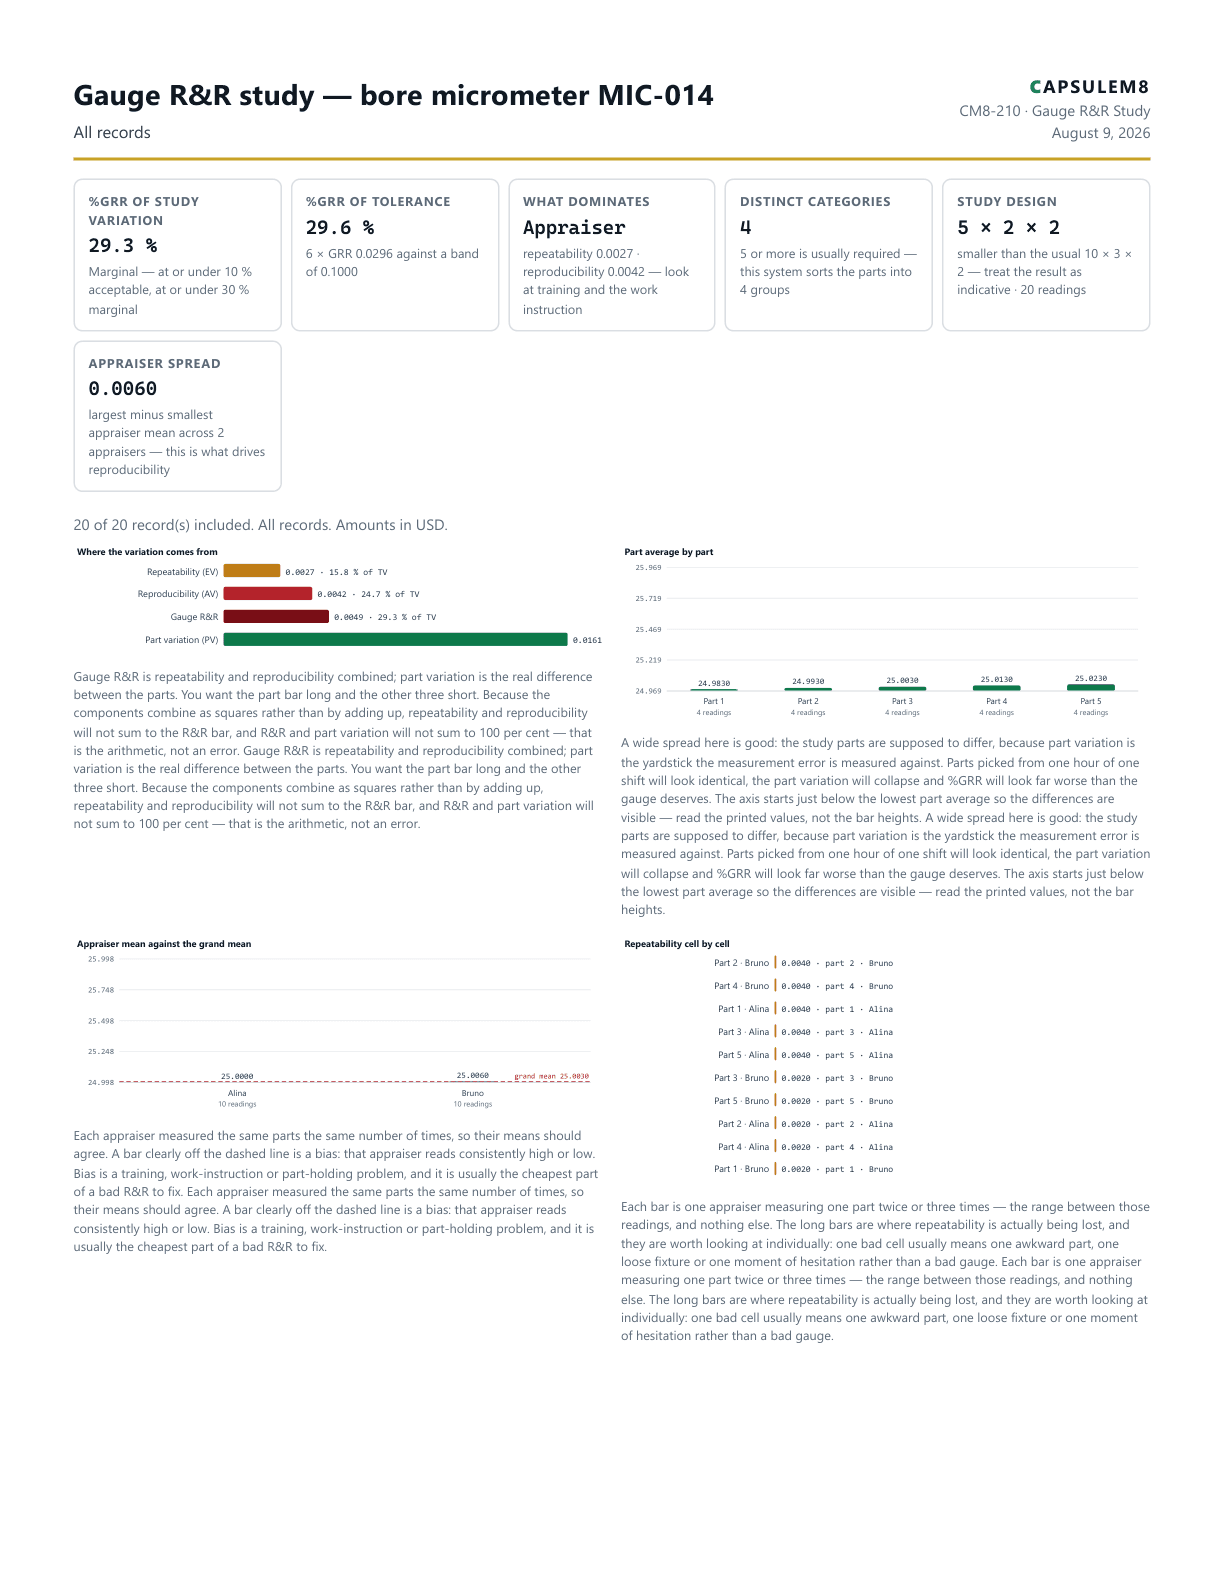
Gauge R&R study — bore micrometer MIC-014

Gauge R&R Study

Run a measurement system analysis by the average and range method: type in every part, appraiser and trial reading and see repeatability, reproducibility, %GRR against study variation and tolerance, and the number of distinct categories your gauge can actually resolve. Type the readings in or import a spreadsheet.

Report detail

Sample study — five parts, two appraisers, two trials. That is a valid design for the average and range method but smaller than the usual ten parts, three appraisers and two trials, so the result is indicative. Note that reproducibility exceeds repeatability here: the two appraisers do not agree with each other more than the gauge disagrees with itself, which points at method and training rather than at the instrument. Replace every reading with your own before relying on anything on this page.

Records
20
Pages
3
Charts
4
Tables
2

Charts: Where the variation comes from, Part average by part, Appraiser mean against the grand mean...

Tables: R&R summary, Measurements

PDF 129 KB - v1.0 - reviewed 2026-08-07

First page of the Gemba walk report PDF
CM8-262
Manufacturing

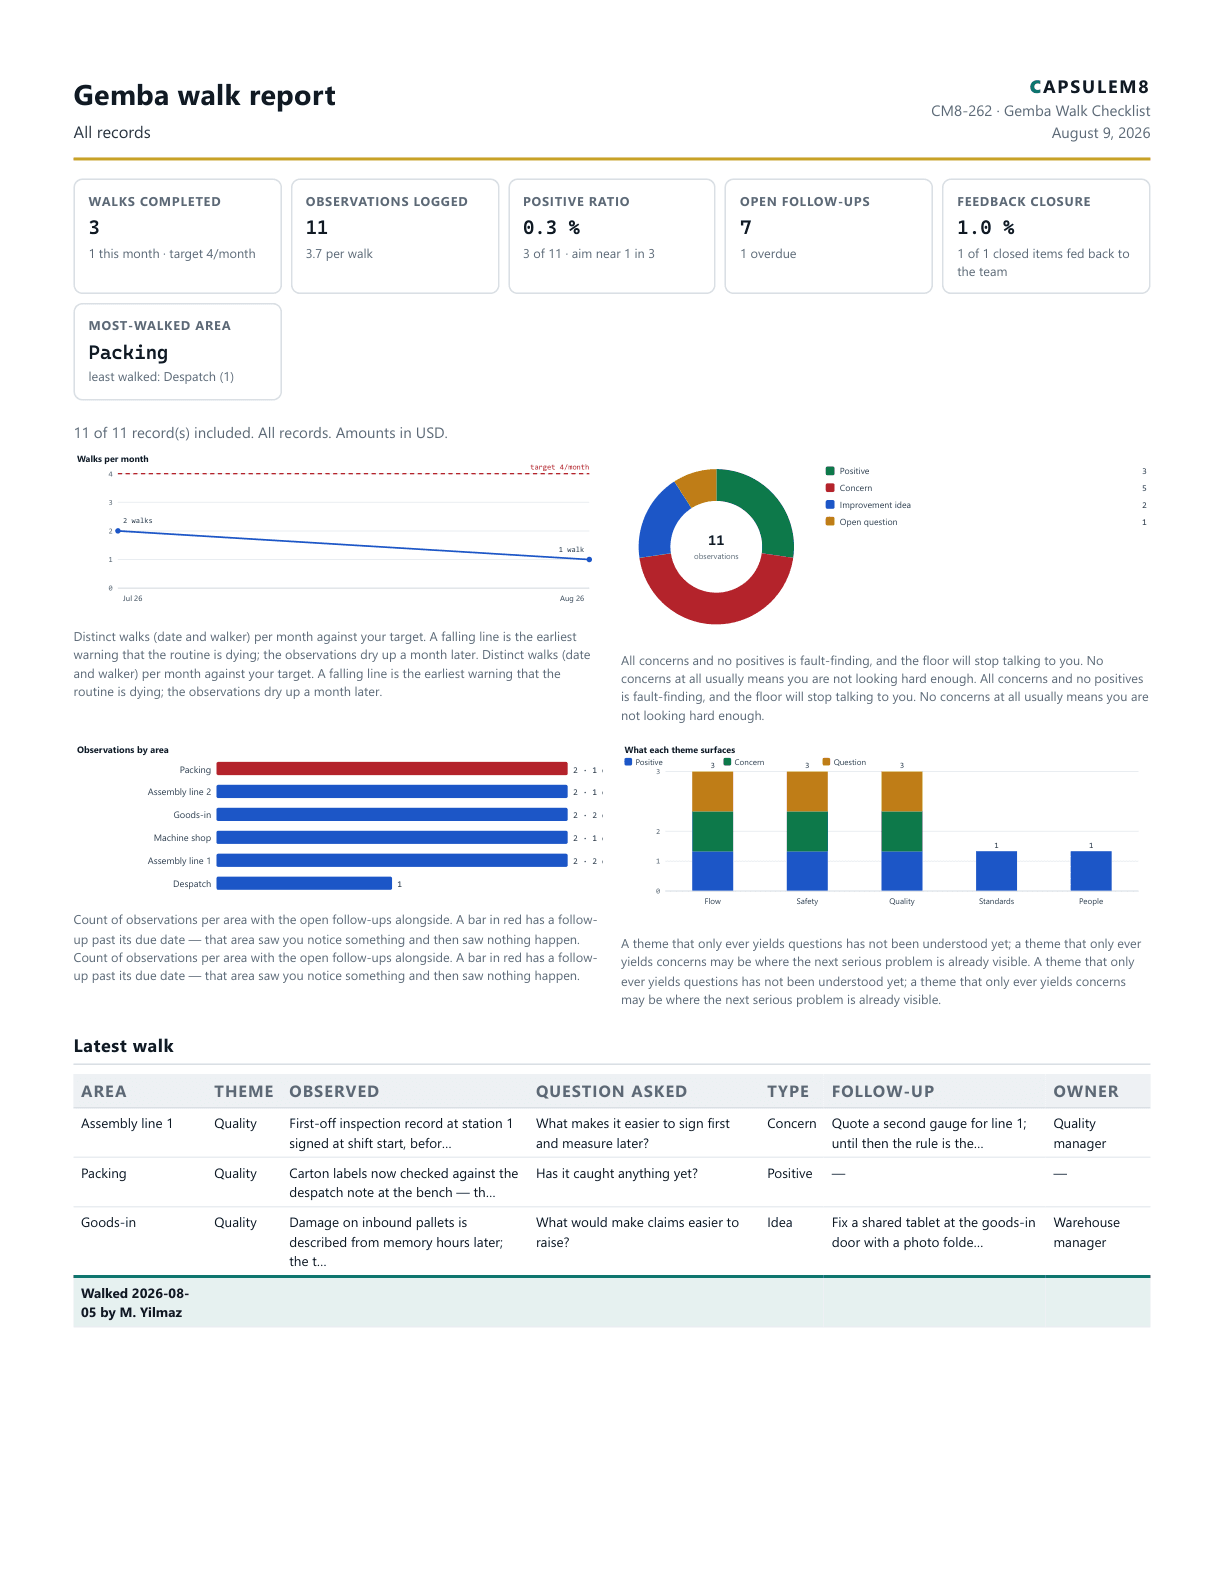
Gemba walk report

Gemba Walk Checklist

Structure your gemba walks — record observations by area and theme, keep the coaching questions and follow-ups honest, watch your walk cadence and close the loop with the team.

Report detail

Sample walks — replace every observation with your own before relying on this or sharing it.

Records
11
Pages
2
Charts
4
Tables
2

Charts: Walks per month, Observation-type mix, Observations by area...

Tables: Latest walk, Open follow-ups

PDF 106 KB - v1.0 - reviewed 2026-08-06
First page of the Continuous improvement report PDF
CM8-261
Manufacturing

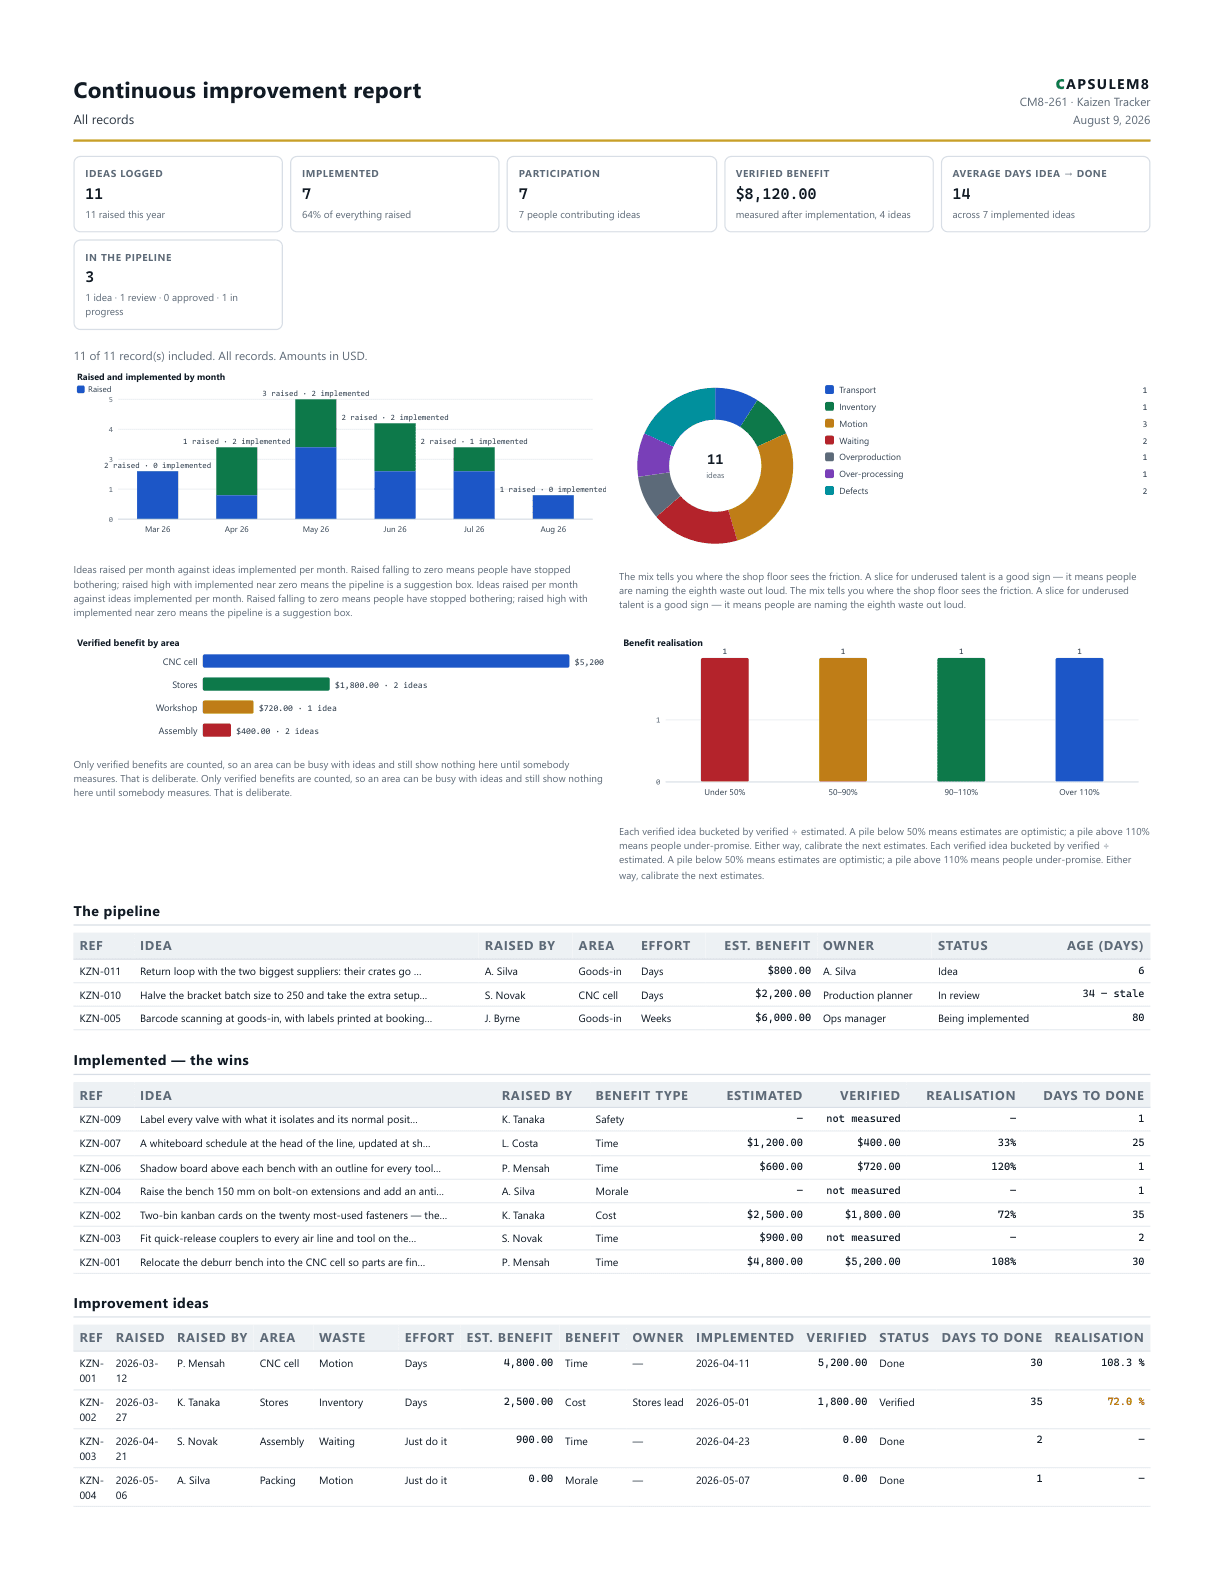
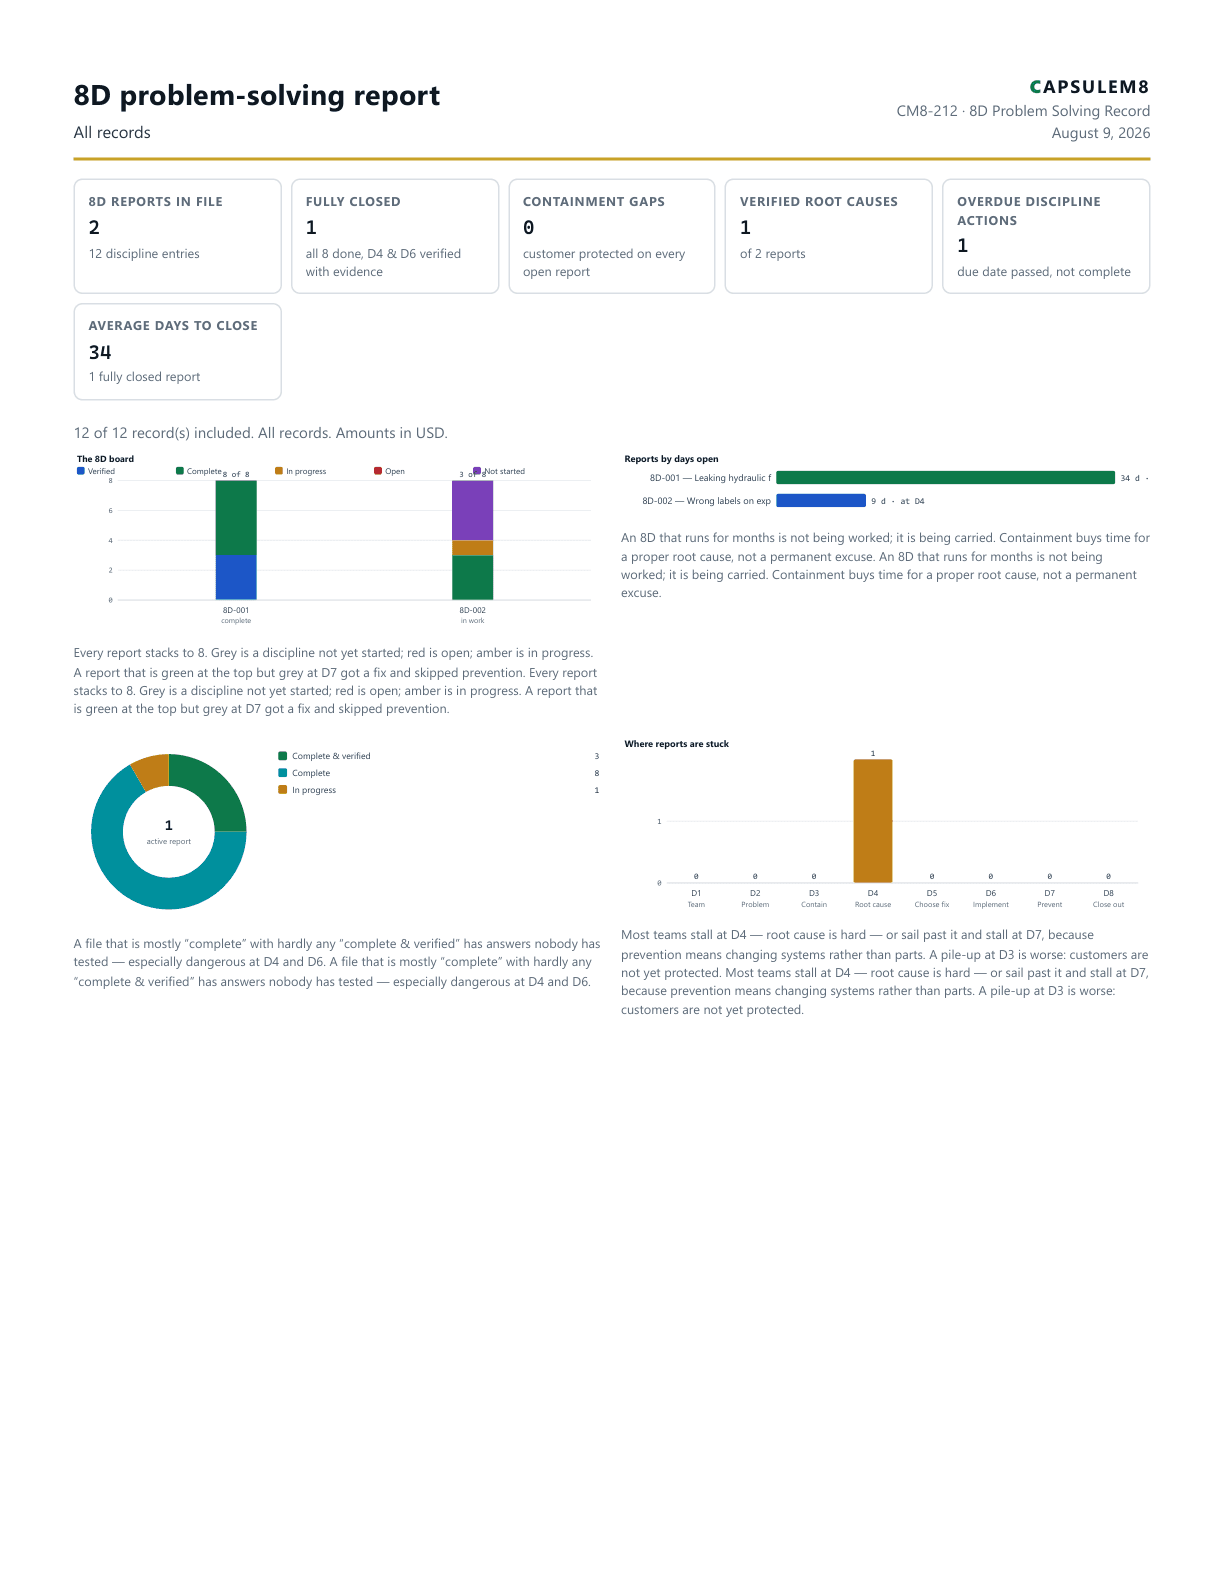
Continuous improvement report

Kaizen Tracker

Run a continuous-improvement idea pipeline — log ideas against the eight wastes, triage by effort, track them to implementation and verify the benefit honestly, with participation as the headline metric.

Report detail

Sample pipeline — replace every idea with your own before relying on it or circulating it.

Records
11
Pages
2
Charts
4
Tables
2

Charts: Raised and implemented by month, Where people see waste, Verified benefit by area...

Tables: The pipeline, Implemented — the wins

PDF 107 KB - v1.0 - reviewed 2026-08-06
First page of the Layered process audit report PDF
CM8-290
Manufacturing

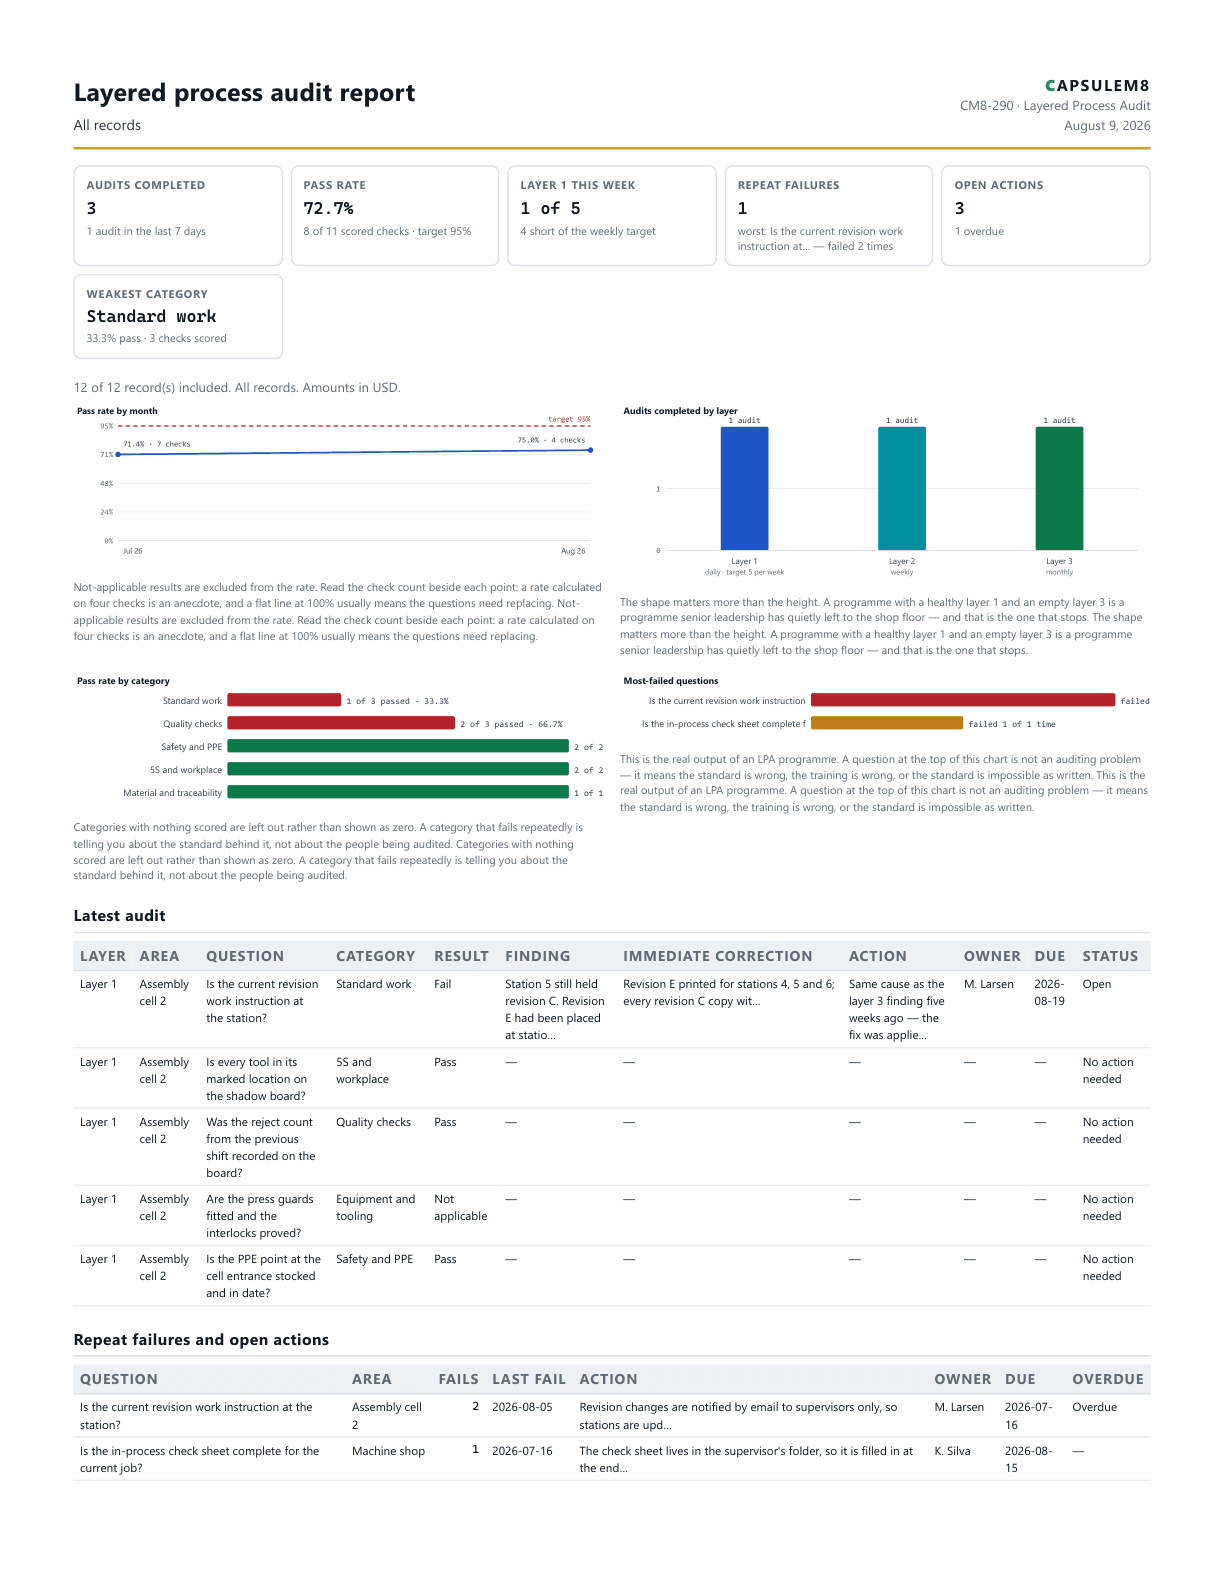
Layered process audit report

Layered Process Audit

Run layered process audits across team leaders, supervisors and senior leadership, record every check pass by pass, and surface the questions that keep failing and the audits that never got done. Runs entirely in your browser —

Report detail

Sample covering three audits across two areas. One question — the work instruction revision at the station — has now failed at two separate layers five weeks apart, and the first action fixed the station rather than the cell. That is the finding worth taking to the review. Replace every entry with your own before circulating this.

Records
12
Pages
3
Charts
4
Tables
2

Charts: Pass rate by month, Audits completed by layer, Pass rate by category...

Tables: Latest audit, Repeat failures and open actions

PDF 100 KB - v1.0 - reviewed 2026-08-07

First page of the Line balancing and Yamazumi study PDF
CM8-287
Manufacturing

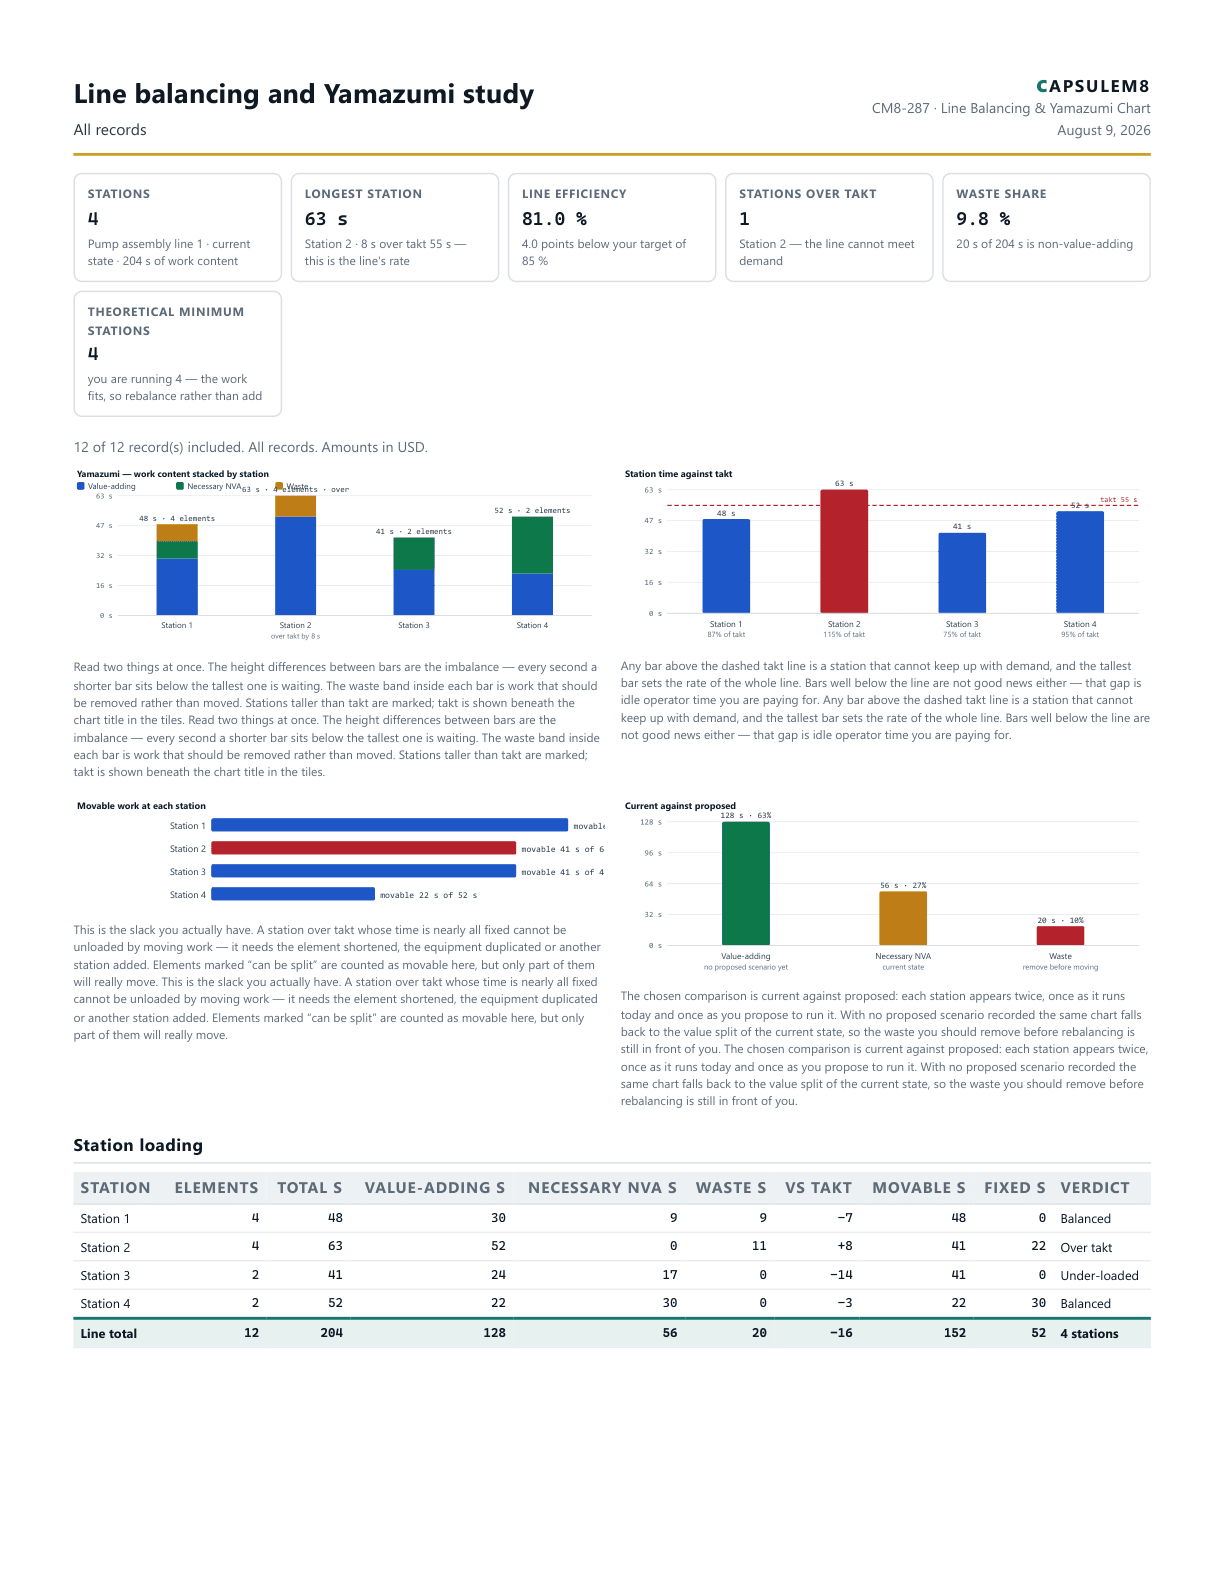
Line balancing and Yamazumi study

Line Balancing & Yamazumi Chart

Assign work elements to stations, compare every station against takt and draw the Yamazumi stacked-time chart — line efficiency, the bottleneck station and the elements that can move, in one working register.

Report detail

Sample study — a four-station pump assembly line running against a takt of 55 seconds. Station 2 is the constraint at 63 seconds, so the line runs at 63 seconds per unit no matter how quickly the other three work. The 204 seconds of work content fits inside four stations, so the answer here is to remove the nine seconds of fetching, then move the sealant bead to station 3, not to add a station. Replace every element and every time with your own before relying on any of it.

Records
12
Pages
3
Charts
4
Tables
2

Charts: Yamazumi — work content stacked by station, Station time against takt, Movable work at each station...

Tables: Station loading, Rebalancing candidates

PDF 104 KB - v1.0 - reviewed 2026-08-07

First page of the Pareto analysis — scrap causes PDF
CM8-241
Manufacturing

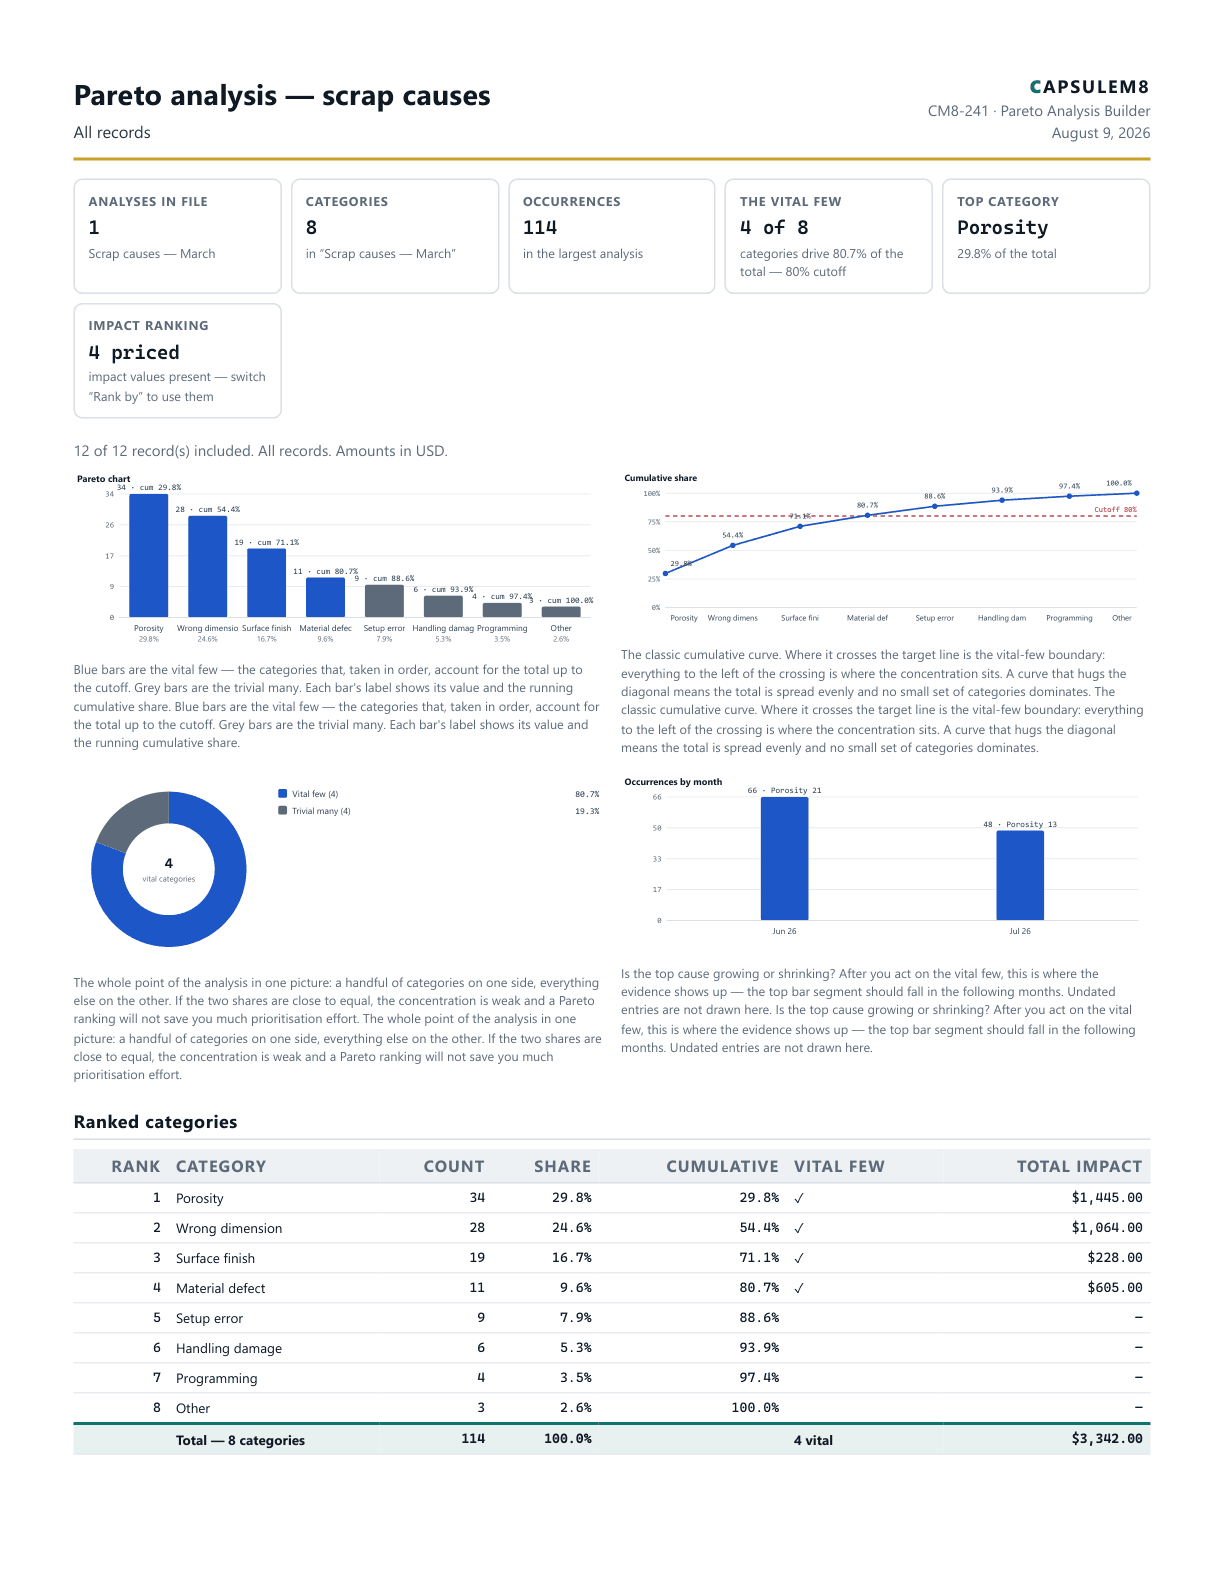
Pareto analysis — scrap causes

Pareto Analysis Builder

Build a proper Pareto analysis — enter defect, complaint or downtime counts, get the ranked bars and the cumulative curve, find the vital few categories worth fixing first, and print a report.

Report detail

Sample analysis — replace every entry with your own counts before relying on it or circulating it.

Records
12
Pages
2
Charts
4
Tables
2

Charts: Pareto chart, Cumulative share, Vital few vs trivial many...

Tables: Ranked categories, Vital-few detail

PDF 122 KB - v1.0 - reviewed 2026-08-06
First page of the Production part approval — submission status PDF
CM8-213
Manufacturing

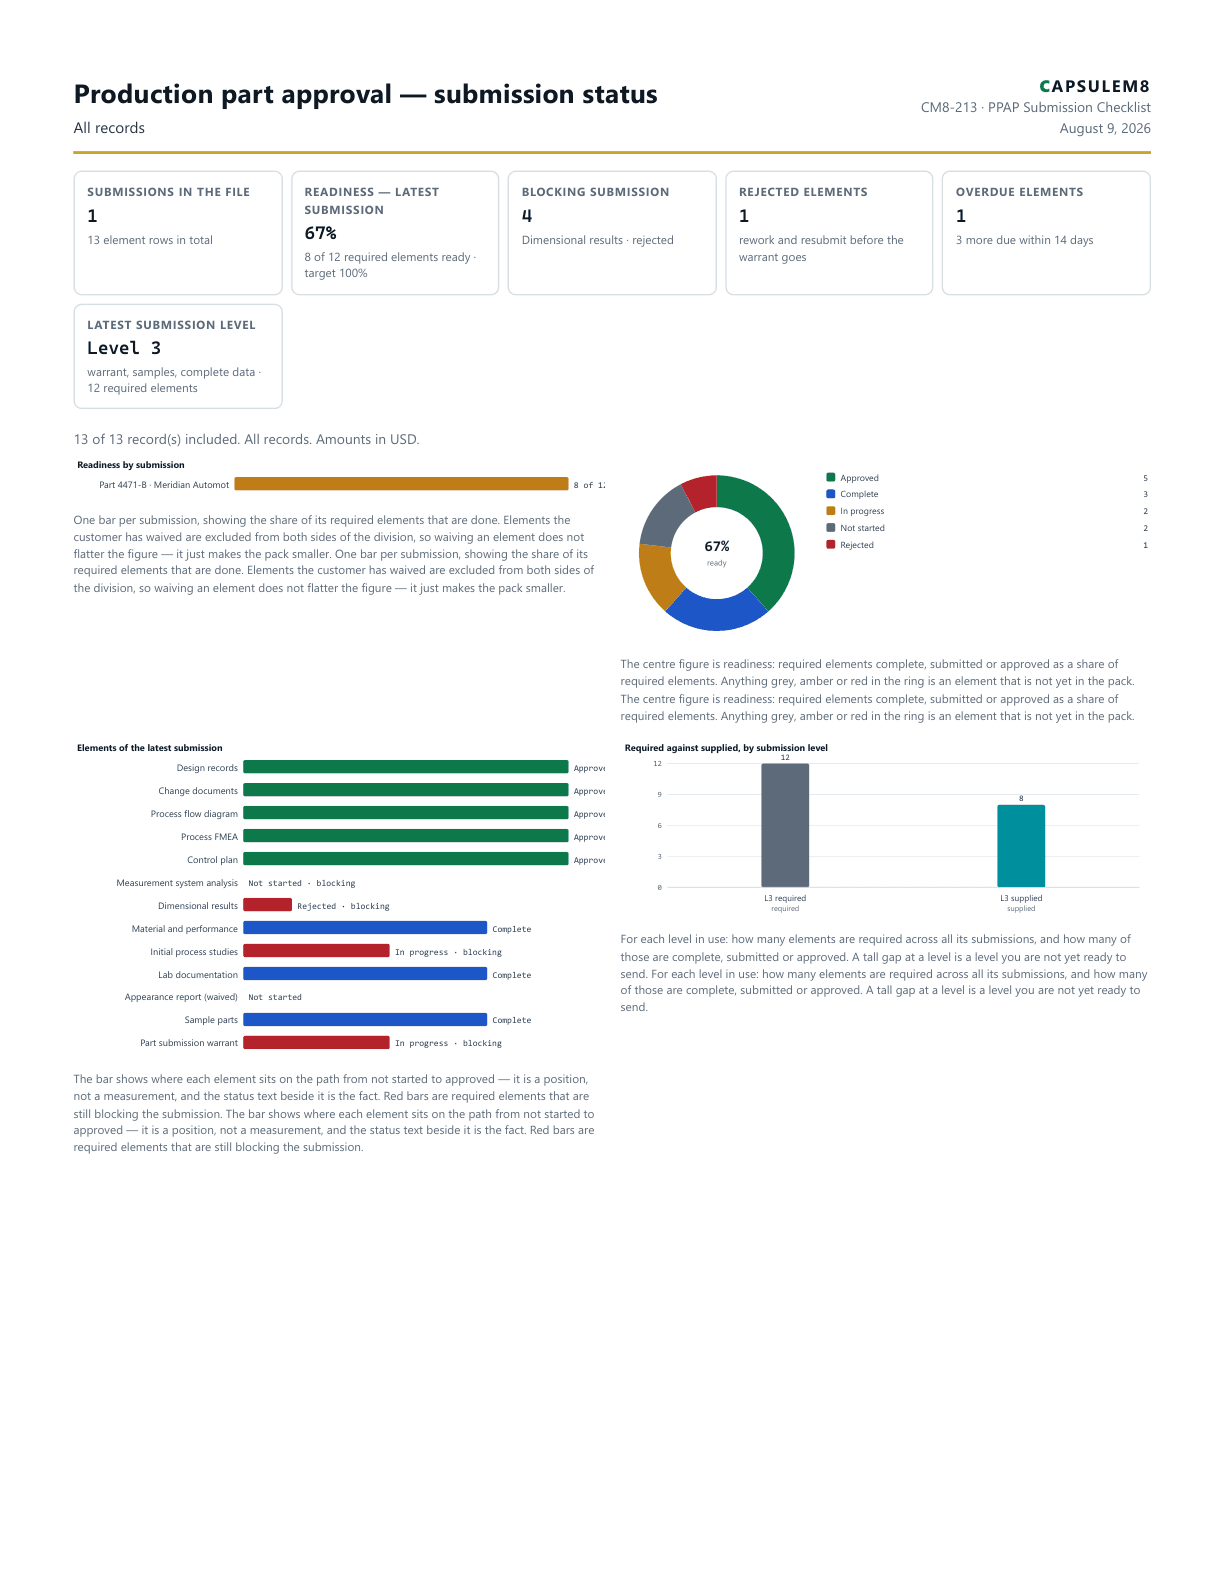
Production part approval — submission status

PPAP Submission Checklist

Track a production part approval submission element by element — submission level, ownership, evidence references, readiness percentage, blocking items and customer rejections — and print the pack status.

Report detail

Sample submission — replace every element with your own before circulating it or sending anything to a customer.

Records
13
Pages
3
Charts
4
Tables
2

Charts: Readiness by submission, Element status — latest submission, Elements of the latest submission...

Tables: The submission pack, Blocking and rejected

PDF 105 KB - v1.0 - reviewed 2026-08-07

First page of the Process capability study — bore diameter, part 4471 PDF
CM8-291
Manufacturing

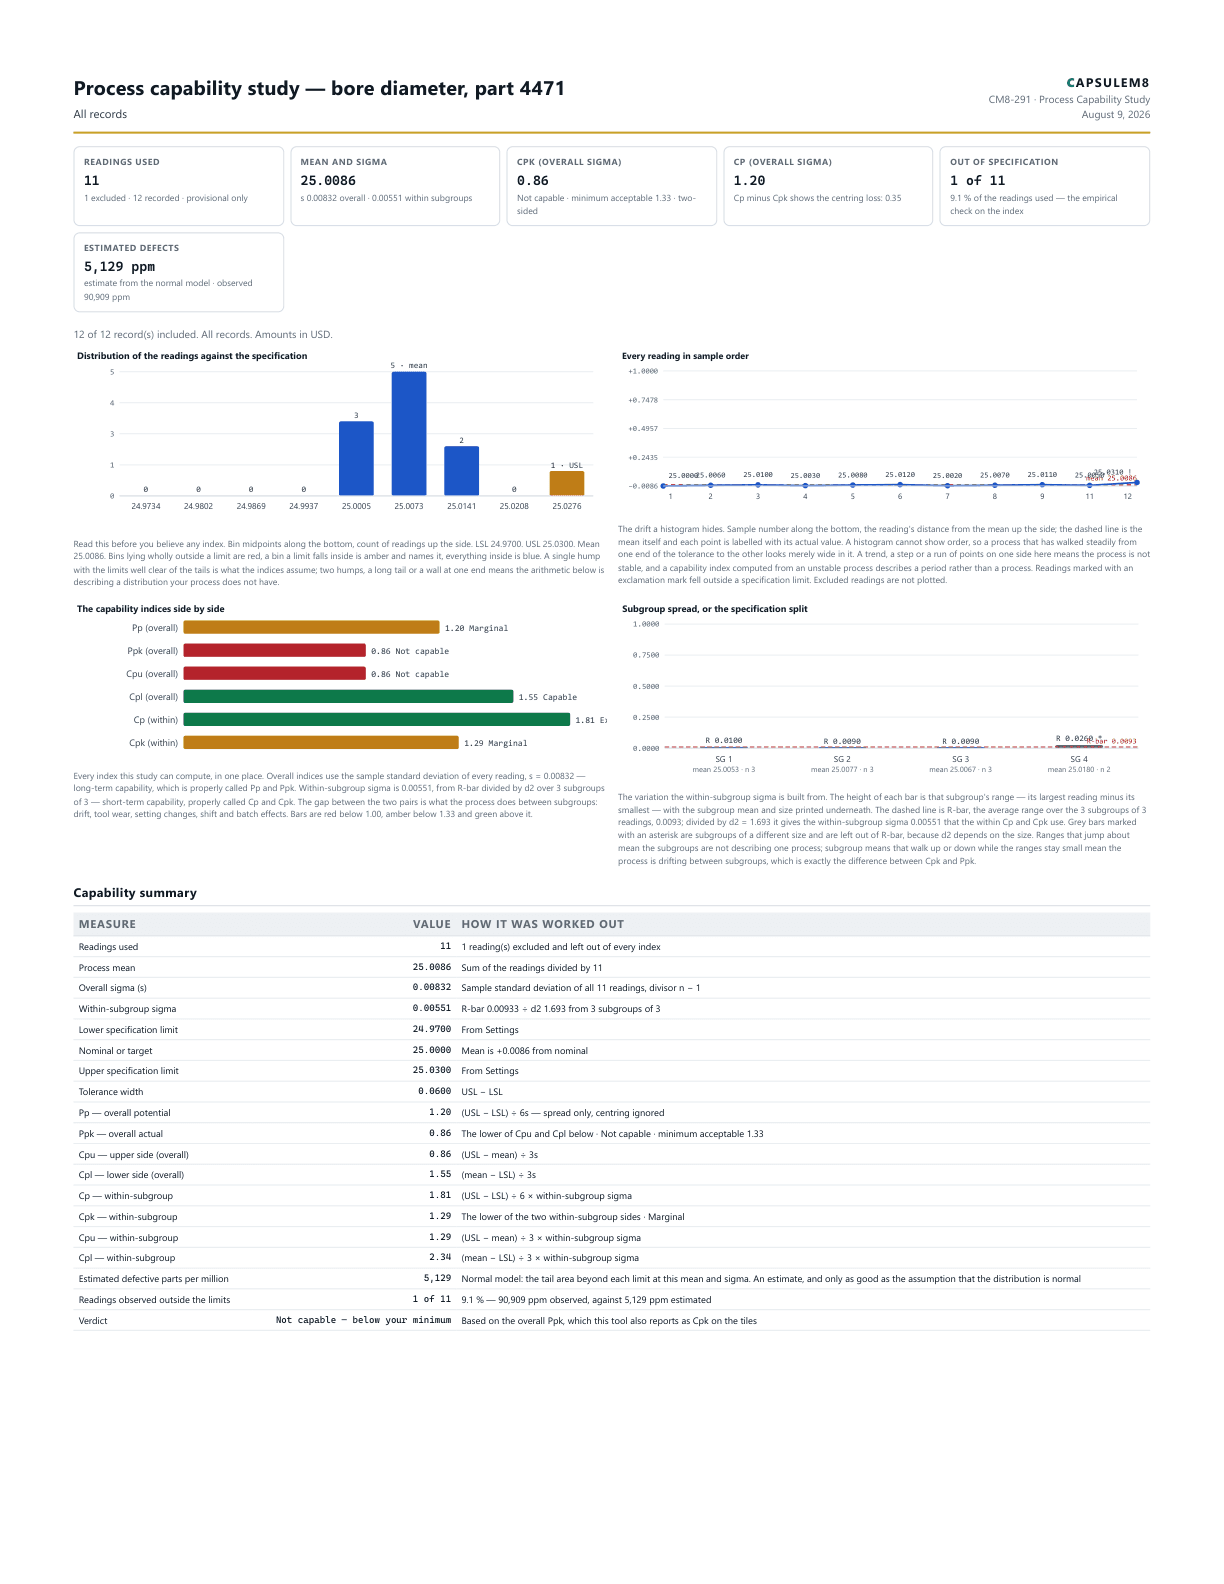
Process capability study — bore diameter, part 4471

Process Capability Study

Enter your measured readings and a specification, and get the whole capability picture: mean, sigma, Cp, Cpk, Cpu, Cpl, Pp, Ppk, an estimated defect rate in parts per million, a histogram against the limits and a run chart that shows the drift an average hides. Type the readings in or import a spreadsheet.

Report detail

Sample study — twelve readings is provisional, not a finished capability study; thirty or more taken across several set-ups is the usual minimum. Note that the mean sits well above the nominal, which is why Ppk is far below Pp, and that one reading is genuinely outside the upper limit while the normal model predicts far fewer. Replace every reading with your own before relying on anything here.

Records
12
Pages
2
Charts
4
Tables
2

Charts: Distribution of the readings against the specification, Every reading in sample order, The capability indices side by side...

Tables: Capability summary, Readings

PDF 121 KB - v1.0 - reviewed 2026-08-07

First page of the Scrap and yield report PDF
CM8-91
Manufacturing

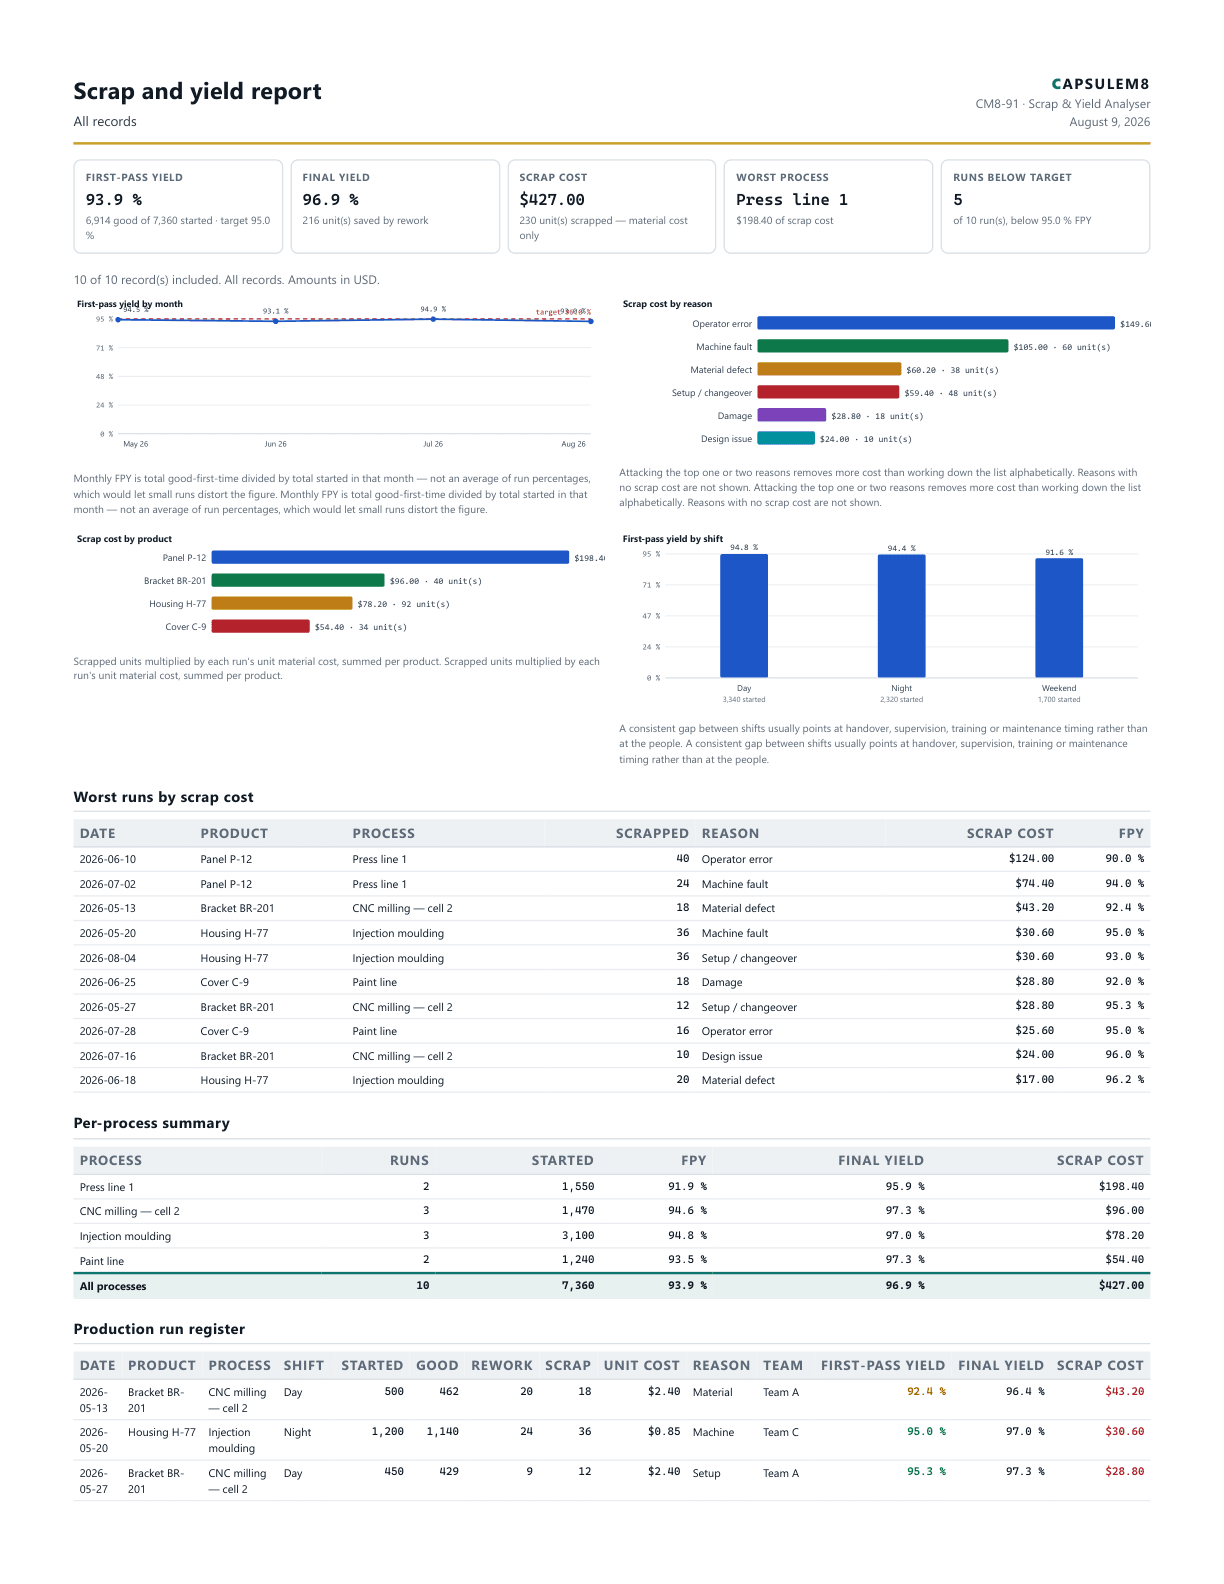
Scrap and yield report

Scrap & Yield Analyser

Log production runs with good, rework and scrap quantities, see first-pass and final yield calculated honestly from totals, and find where scrap cost really comes from. Runs entirely in your browser.

Report detail

Sample data — replace every run with your own before relying on the figures or circulating this report.

Records
10
Pages
2
Charts
4
Tables
2

Charts: First-pass yield by month, Scrap cost by reason, Scrap cost by product...

Tables: Worst runs by scrap cost, Per-process summary

PDF 109 KB - v1.0 - reviewed 2026-08-05

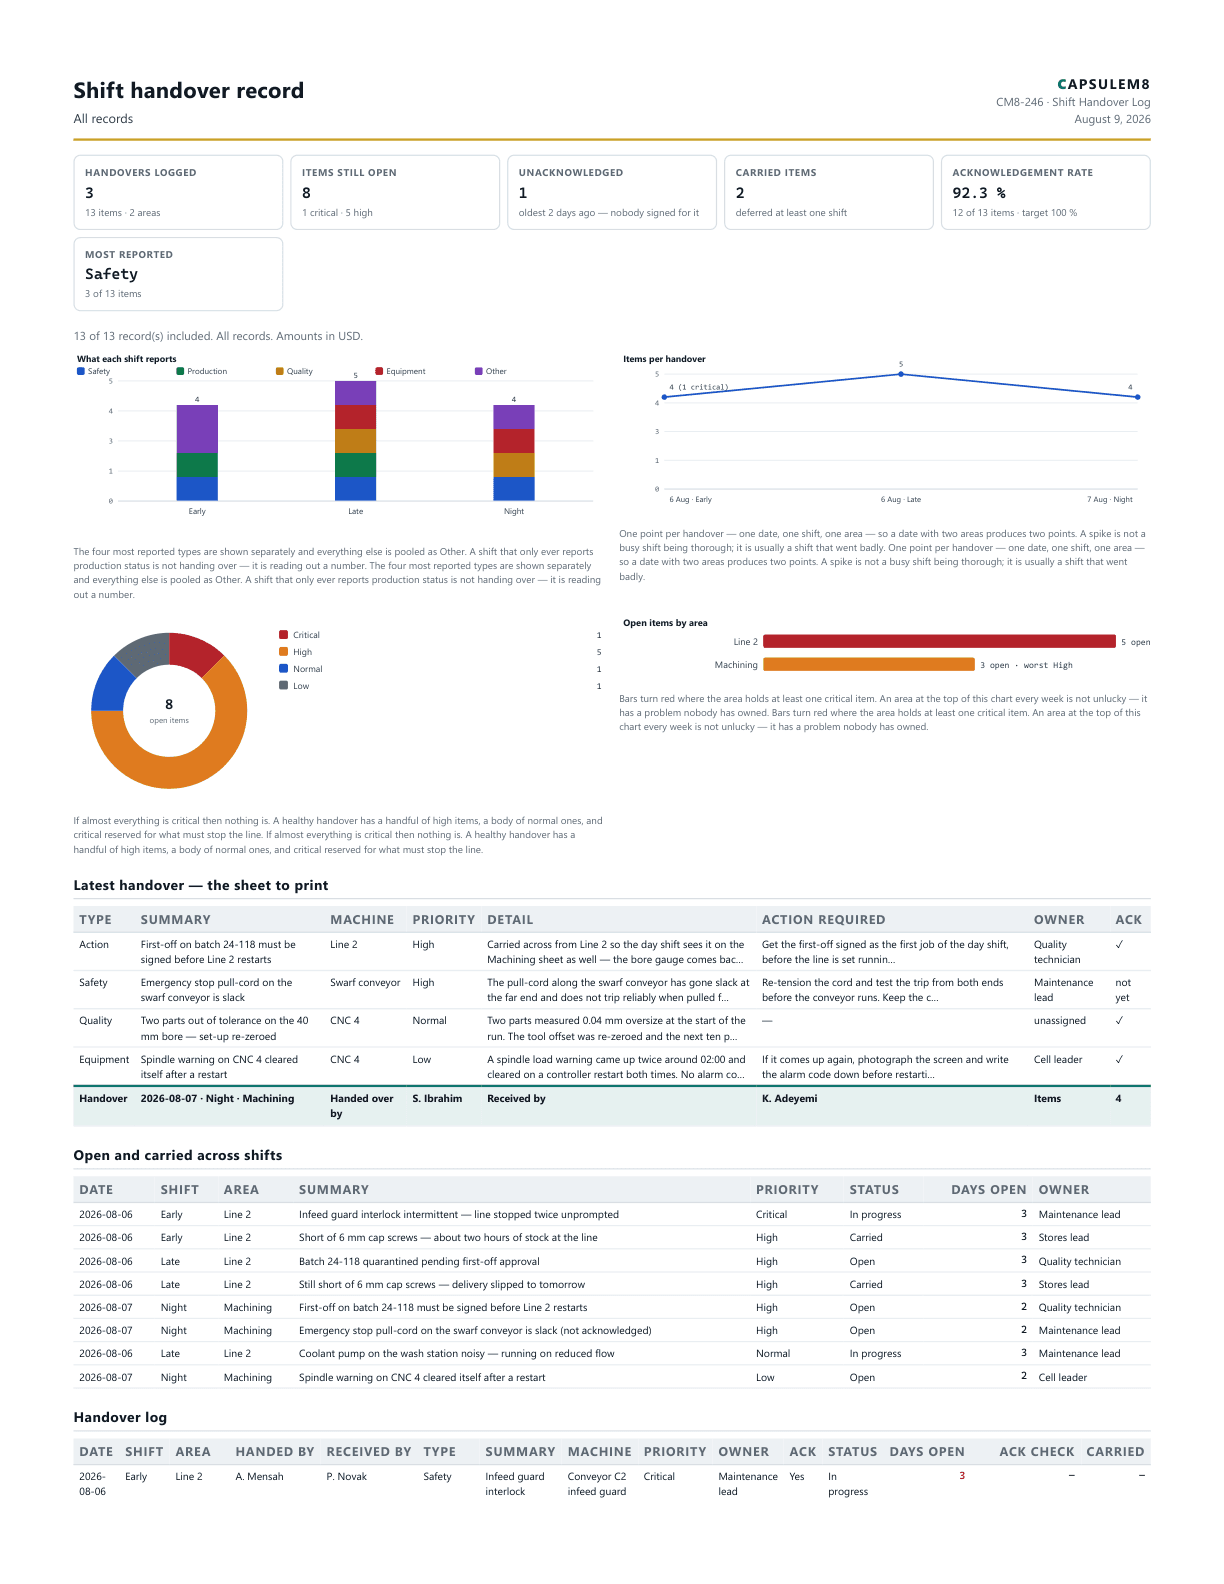
First page of the Shift handover record PDF
CM8-246
Manufacturing

Shift handover record

Shift Handover Log

Record what the outgoing shift tells the incoming one — safety conditions, production status, quality holds, equipment faults, shortages and actions — with acknowledgement tracking and a printable handover sheet. This is the handover log, not a rota or roster.

Report detail

Sample handover log covering two days and three shifts across Line 2 and Machining. Replace every item with your own before relying on it or circulating it. Note the outstanding item from the night shift that nobody signed for — that is the failure mode this log exists to make visible.

Records
13
Pages
2
Charts
4
Tables
2

Charts: What each shift reports, Items per handover, Priority of the open items...

Tables: Latest handover — the sheet to print, Open and carried across shifts

PDF 110 KB - v1.0 - reviewed 2026-08-07

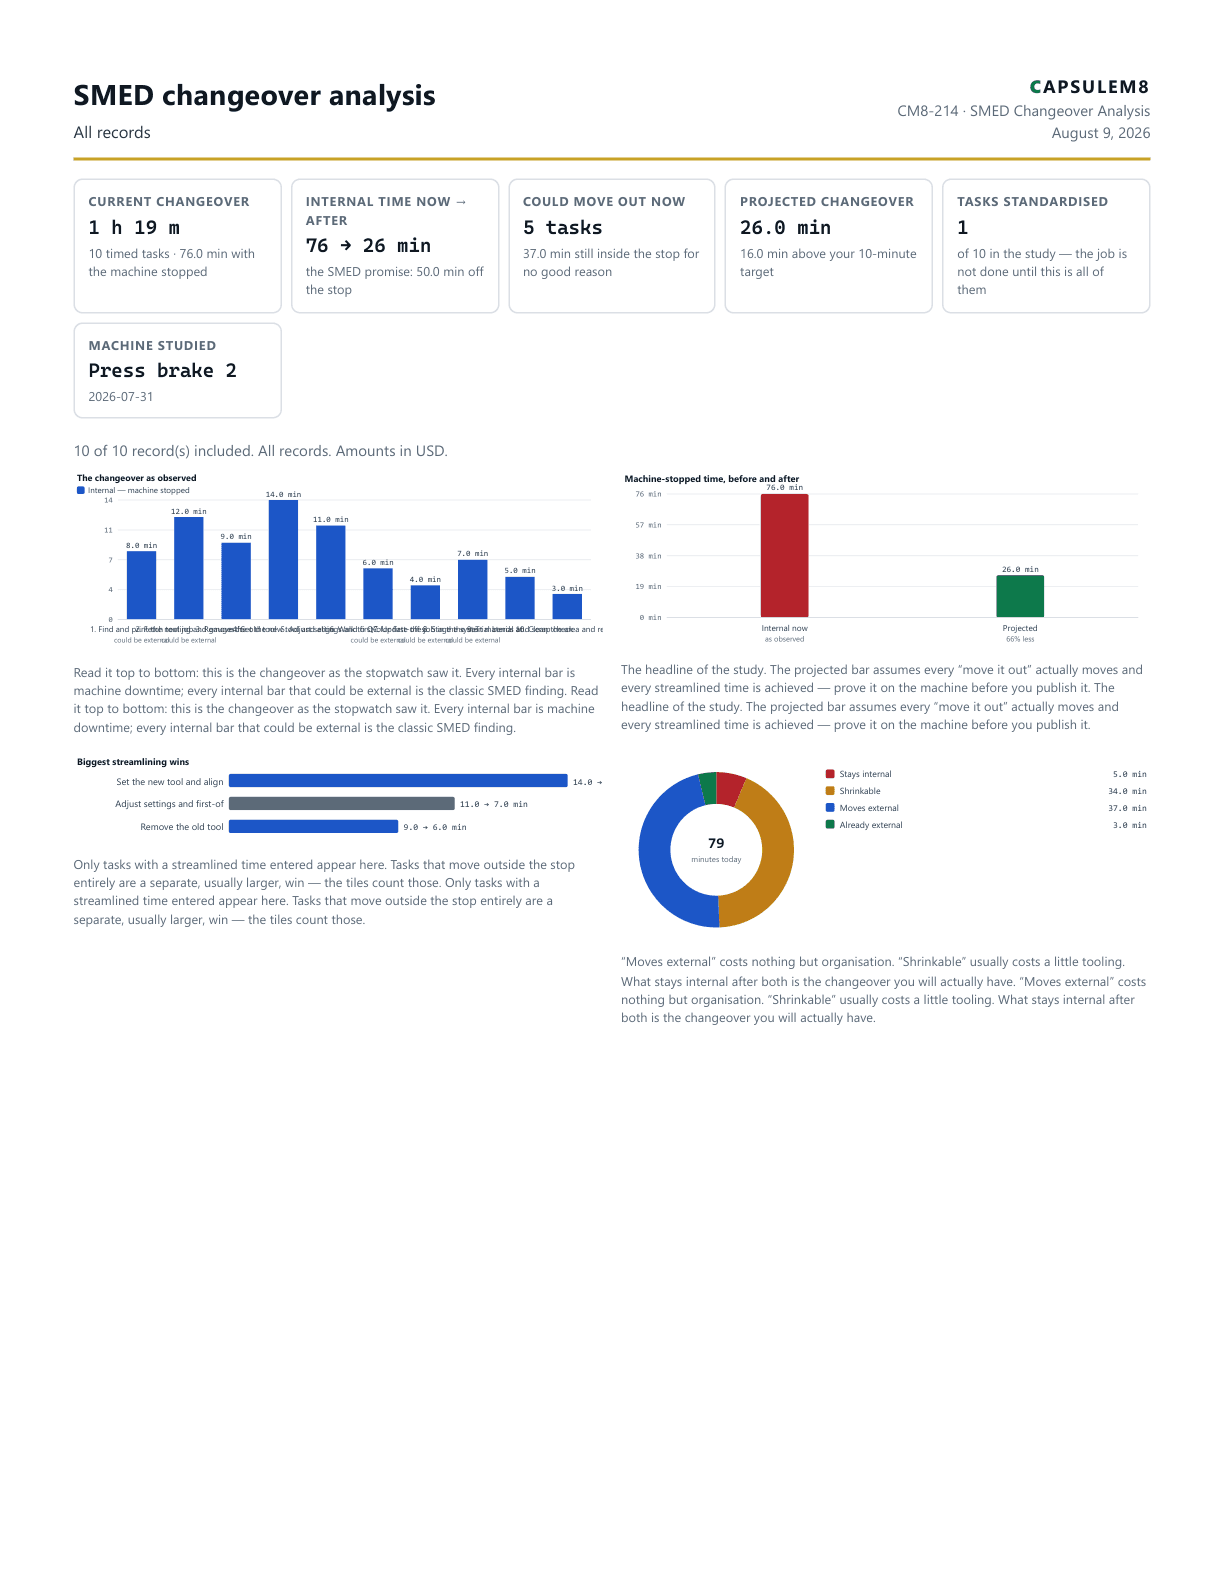
First page of the SMED changeover analysis PDF
CM8-214
Manufacturing

SMED changeover analysis

SMED Changeover Analysis

Time a changeover task by task, separate internal from external work, move tasks outside the machine stop and project the shorter changeover before spending anything — the SMED method in a working register.

Report detail

Sample study — replace every task with your own timings before relying on the projection.

Records
10
Pages
3
Charts
4
Tables
2

Charts: The changeover as observed, Machine-stopped time, before and after, Biggest streamlining wins...

Tables: The changeover, task by task, Implementation plan

PDF 118 KB - v1.0 - reviewed 2026-08-06
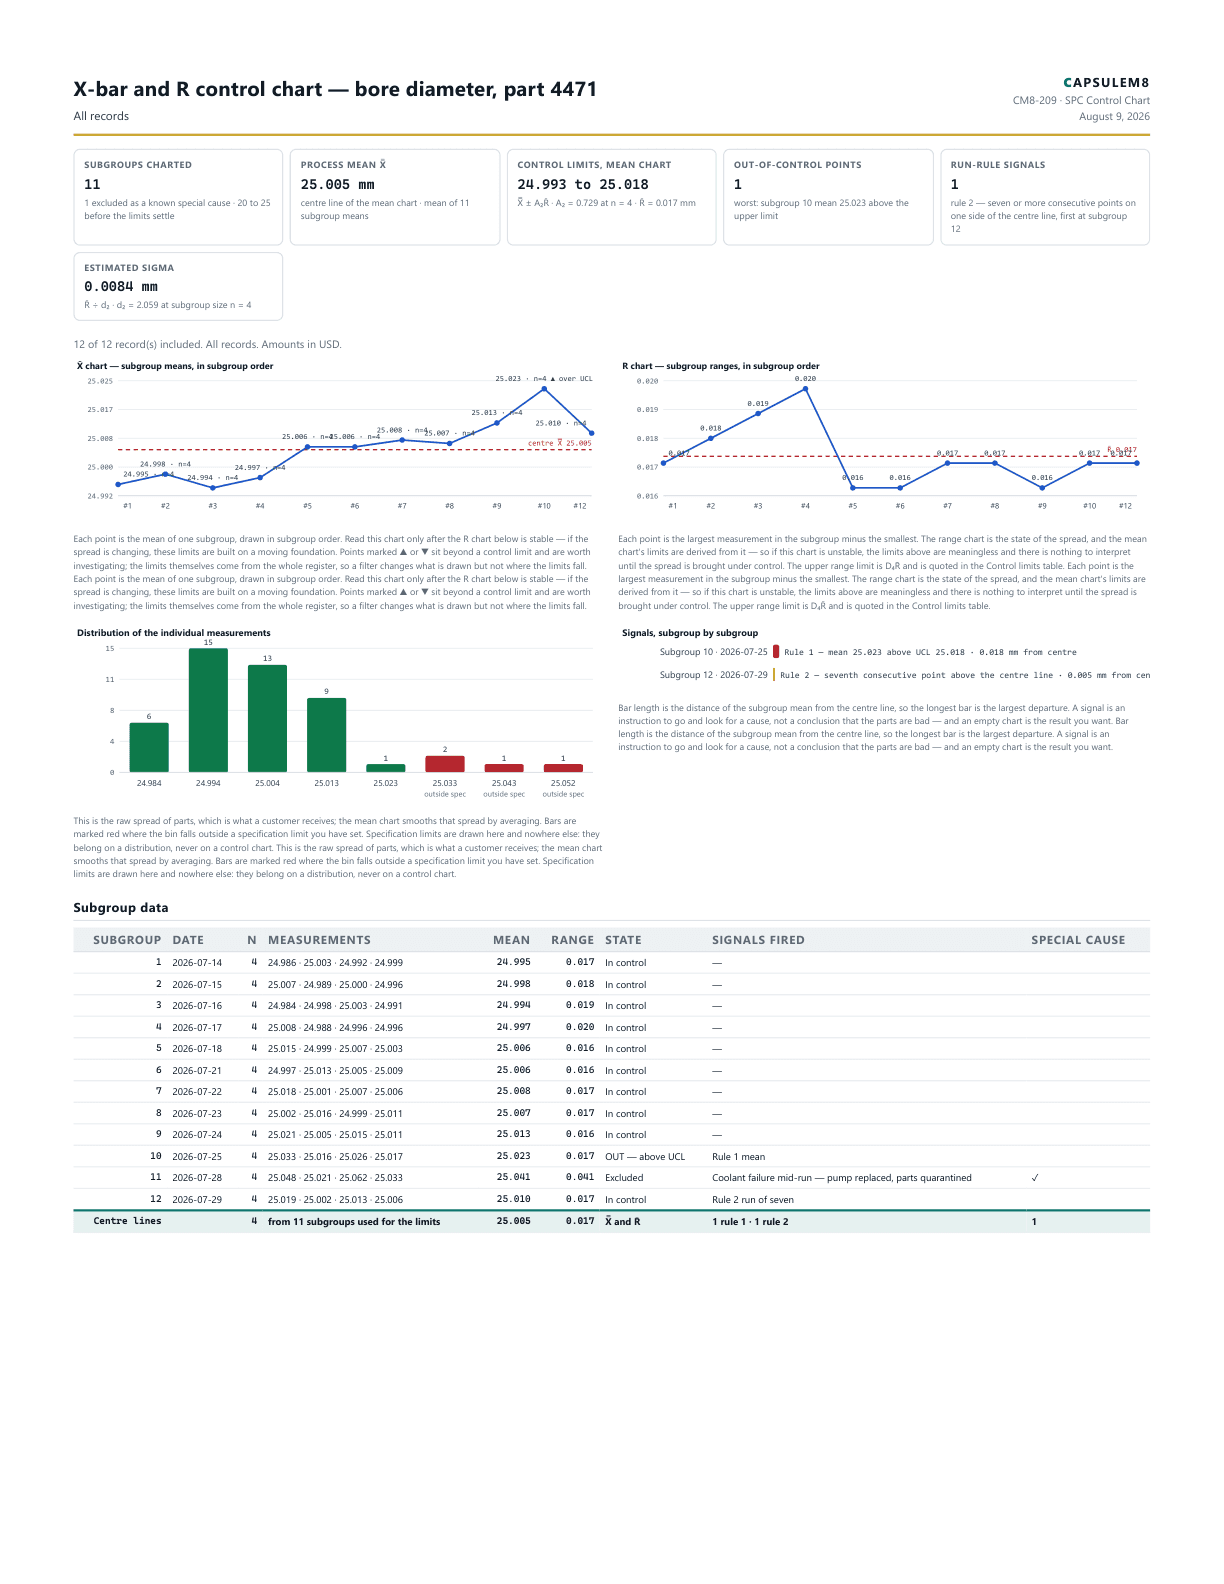
First page of the X-bar and R control chart — bore diameter, part 4471 PDF
CM8-209
Manufacturing

X-bar and R control chart — bore diameter, part 4471

SPC Control Chart

Plot an X-bar and R control chart from measured subgroups: centre lines, control limits from the standard A2, D3, D4 and d2 constants, out-of-control points and runs of seven, with the process sigma estimated from the average range. Type the readings in or import a spreadsheet.

Report detail

Sample study — twelve subgroups of four, one of them excluded for a known coolant failure. Twelve subgroups is a start, not a settled set of limits: recalculate at twenty to twenty-five. Replace every reading with your own before relying on anything here.

Records
12
Pages
2
Charts
4
Tables
2

Charts: X̄ chart — subgroup means, in subgroup order, R chart — subgroup ranges, in subgroup order, Distribution of the individual measurements...

Tables: Subgroup data, Control limits and capability context

PDF 127 KB - v1.0 - reviewed 2026-08-07

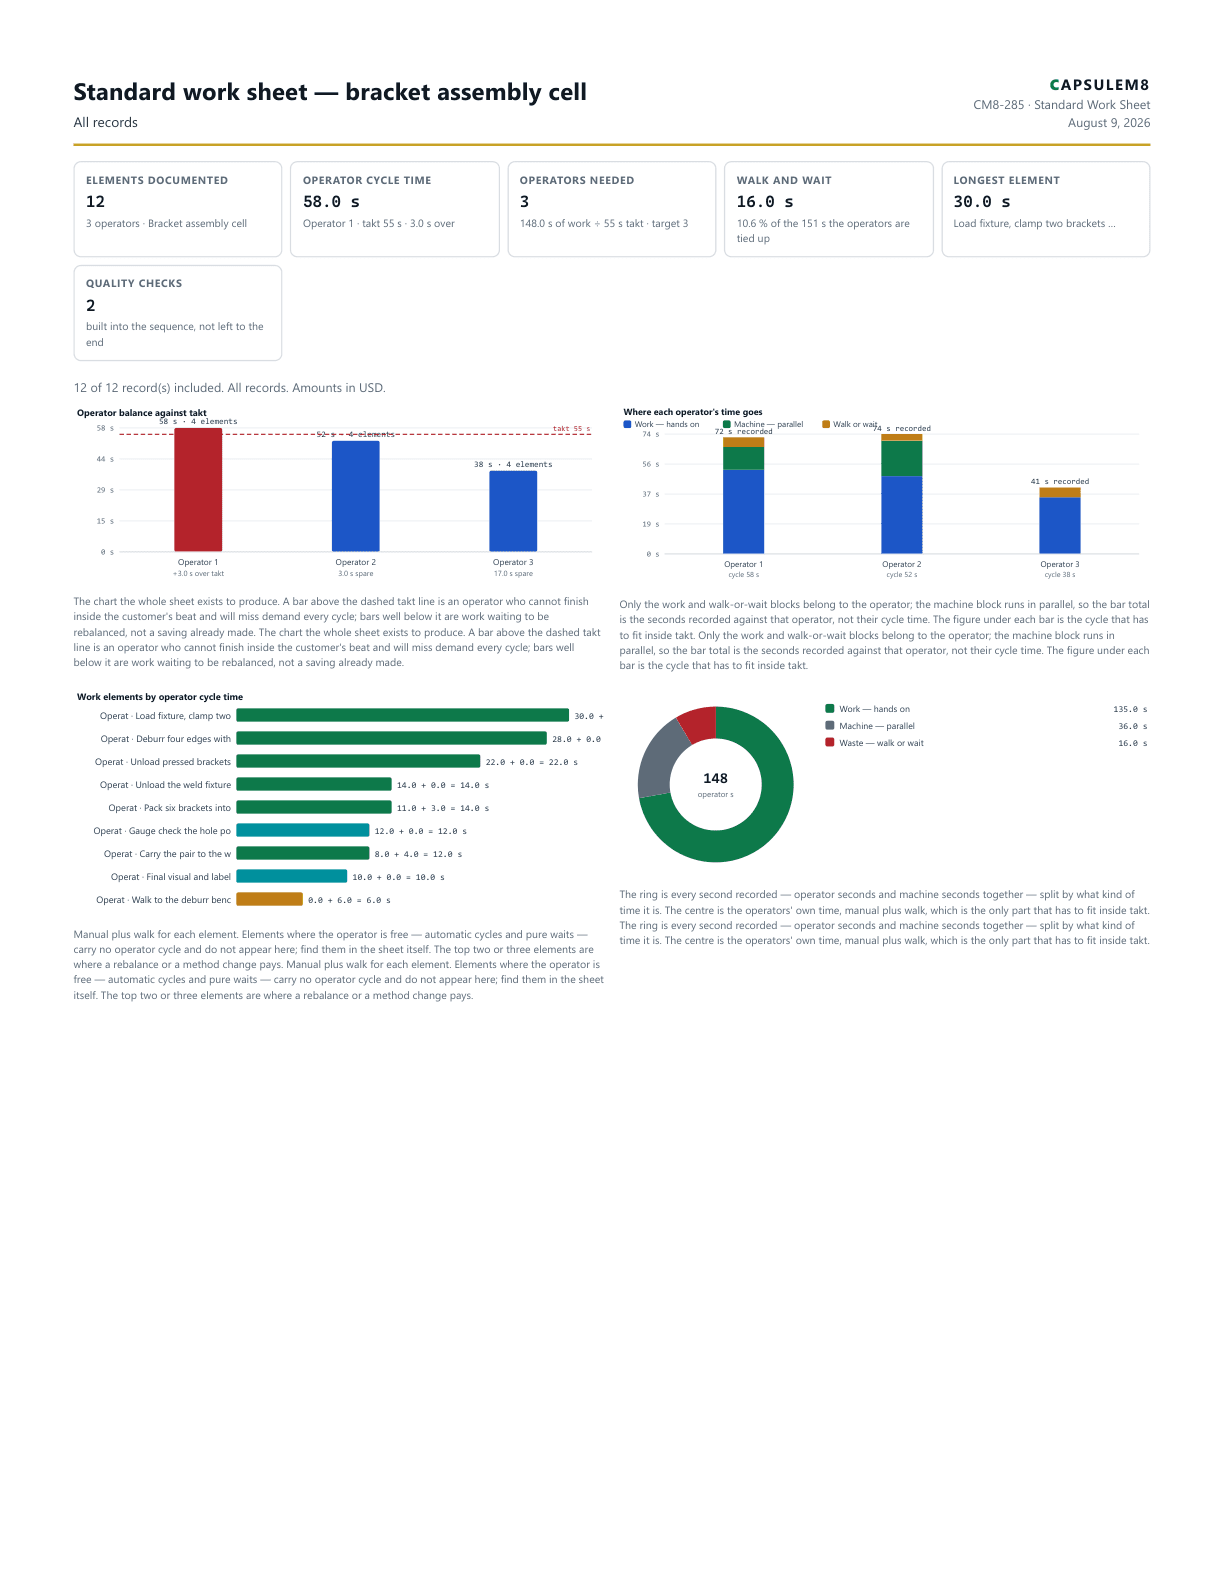
First page of the Standard work sheet — bracket assembly cell PDF
CM8-285
Manufacturing

Standard work sheet — bracket assembly cell

Standard Work Sheet

Write standard work properly: every work element, its manual, machine and walk time, the sequence, the standard WIP, and the operator balance against takt — with machine time kept parallel instead of wrongly added.

Report detail

Sample cell at a takt of 55 s. Operator 1 runs 3 s over takt and will miss demand every cycle; Operator 3 is 17 s under-loaded. The obvious first move is the 6 s walk to the deburr bench — bring the bench to the press and Operator 1 falls to 52 s without anyone working faster. Replace every element and time with your own before relying on this.

Records
12
Pages
3
Charts
4
Tables
2

Charts: Operator balance against takt, Where each operator's time goes, Work elements by operator cycle time...

Tables: The standard work sheet, Balance and waste, operator by operator

PDF 121 KB - v1.0 - reviewed 2026-08-07

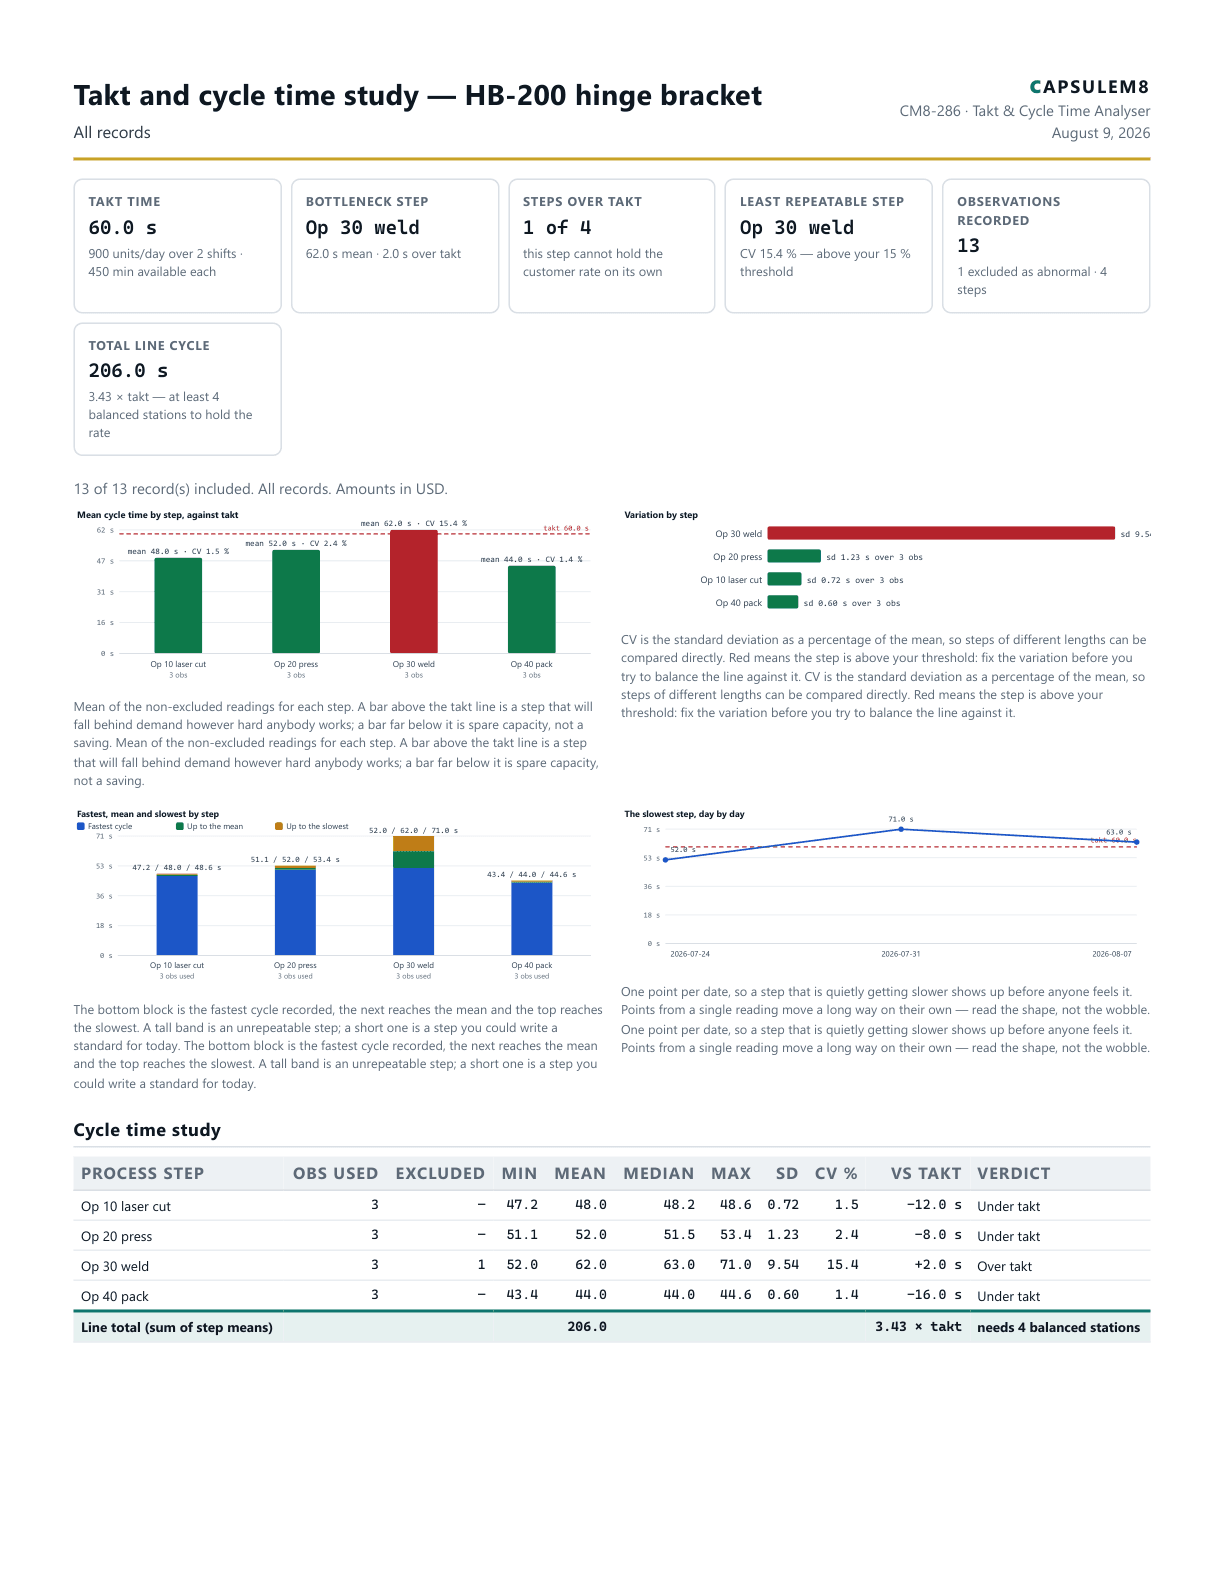
First page of the Takt and cycle time study — HB-200 hinge bracket PDF
CM8-286
Manufacturing

Takt and cycle time study — HB-200 hinge bracket

Takt & Cycle Time Analyser

Work out takt time from your available production time and customer demand, then time each process step with a stopwatch and see which steps run over takt, which ones are too variable to standardise, and where the bottleneck really is. Type the readings in or import a spreadsheet.

Report detail

Sample study — three cycles per step over three days, which is enough to see the shape of the process and nowhere near enough to set a standard from. Replace every reading with your own before relying on anything here.

Records
13
Pages
3
Charts
4
Tables
2

Charts: Mean cycle time by step, against takt, Variation by step, Fastest, mean and slowest by step...

Tables: Cycle time study, Observations

PDF 120 KB - v1.0 - reviewed 2026-08-07

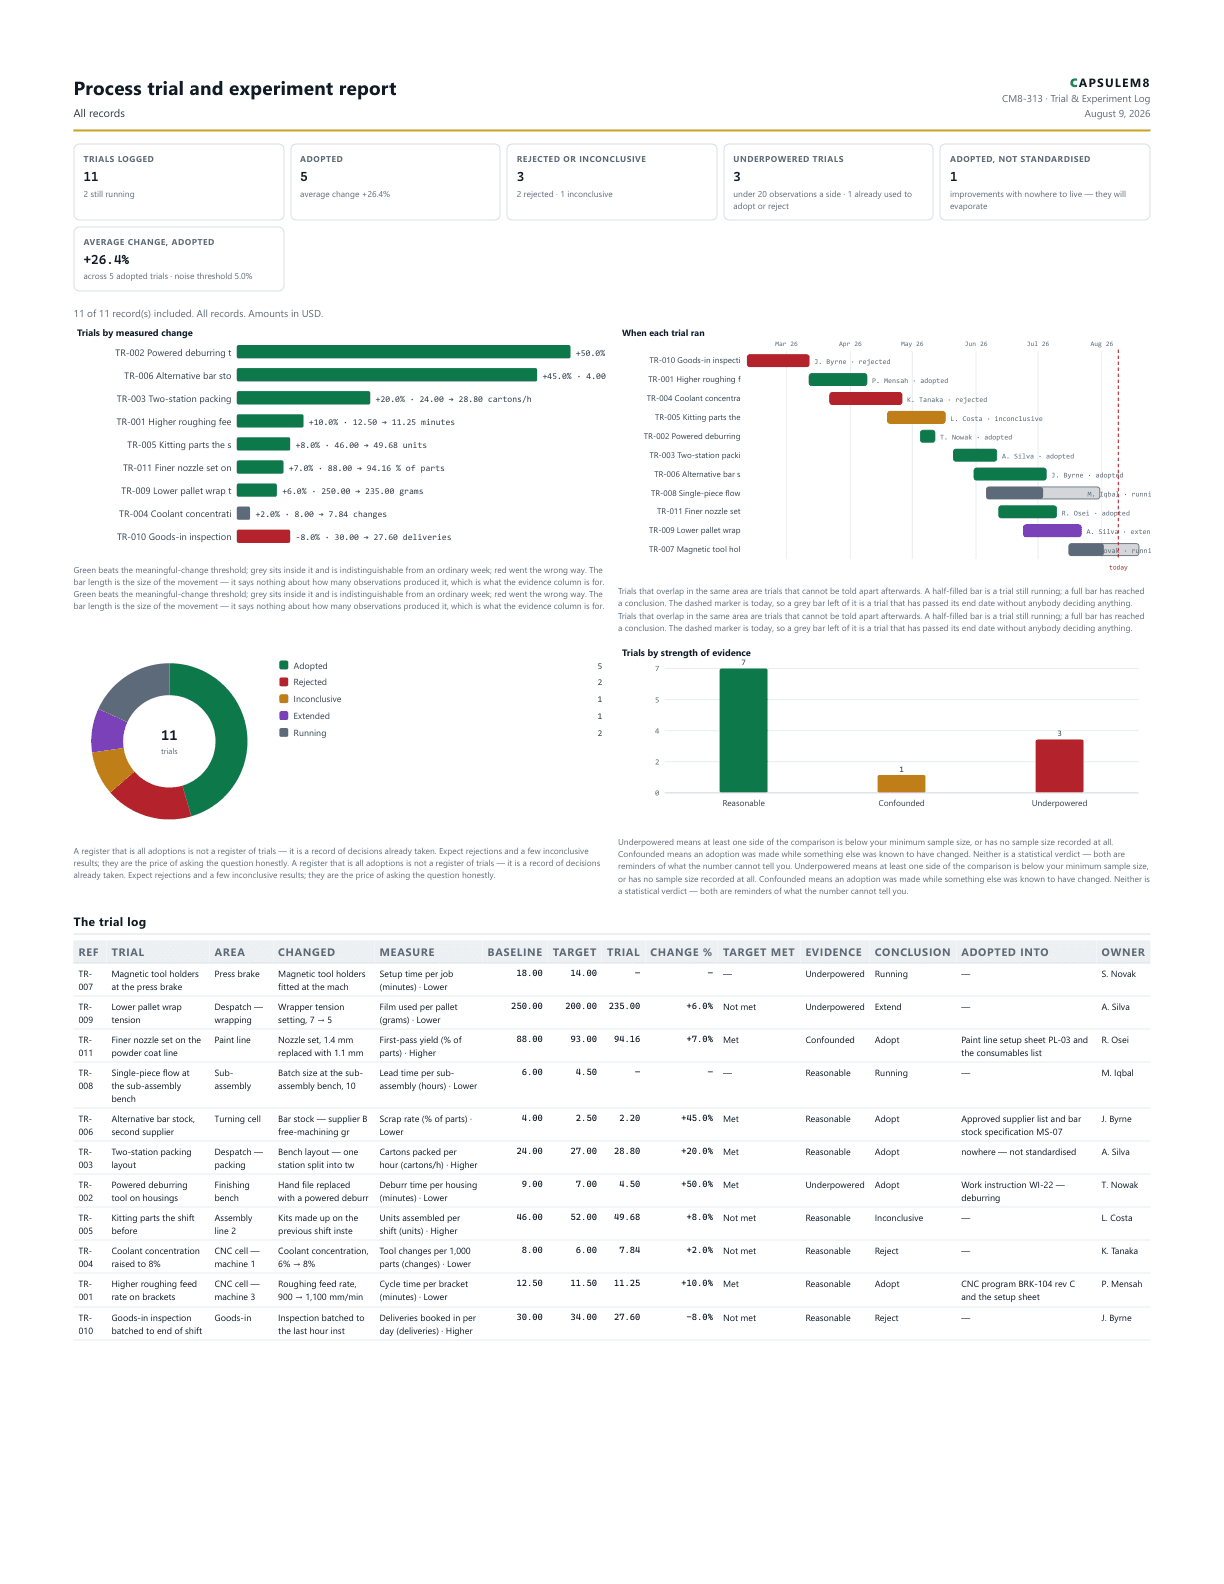
First page of the Process trial and experiment report PDF
CM8-313
Manufacturing

Process trial and experiment report

Trial & Experiment Log

Run process trials that prove something — a hypothesis written before you start, a measured baseline, one variable changed, a success threshold agreed in advance, and an honest conclusion with the sample size printed next to it.

Report detail

Sample register — replace every trial with your own before relying on it or circulating it.

Records
11
Pages
2
Charts
4
Tables
2

Charts: Trials by measured change, When each trial ran, How trials ended...

Tables: The trial log, Credibility check

PDF 117 KB - v1.0 - reviewed 2026-08-07

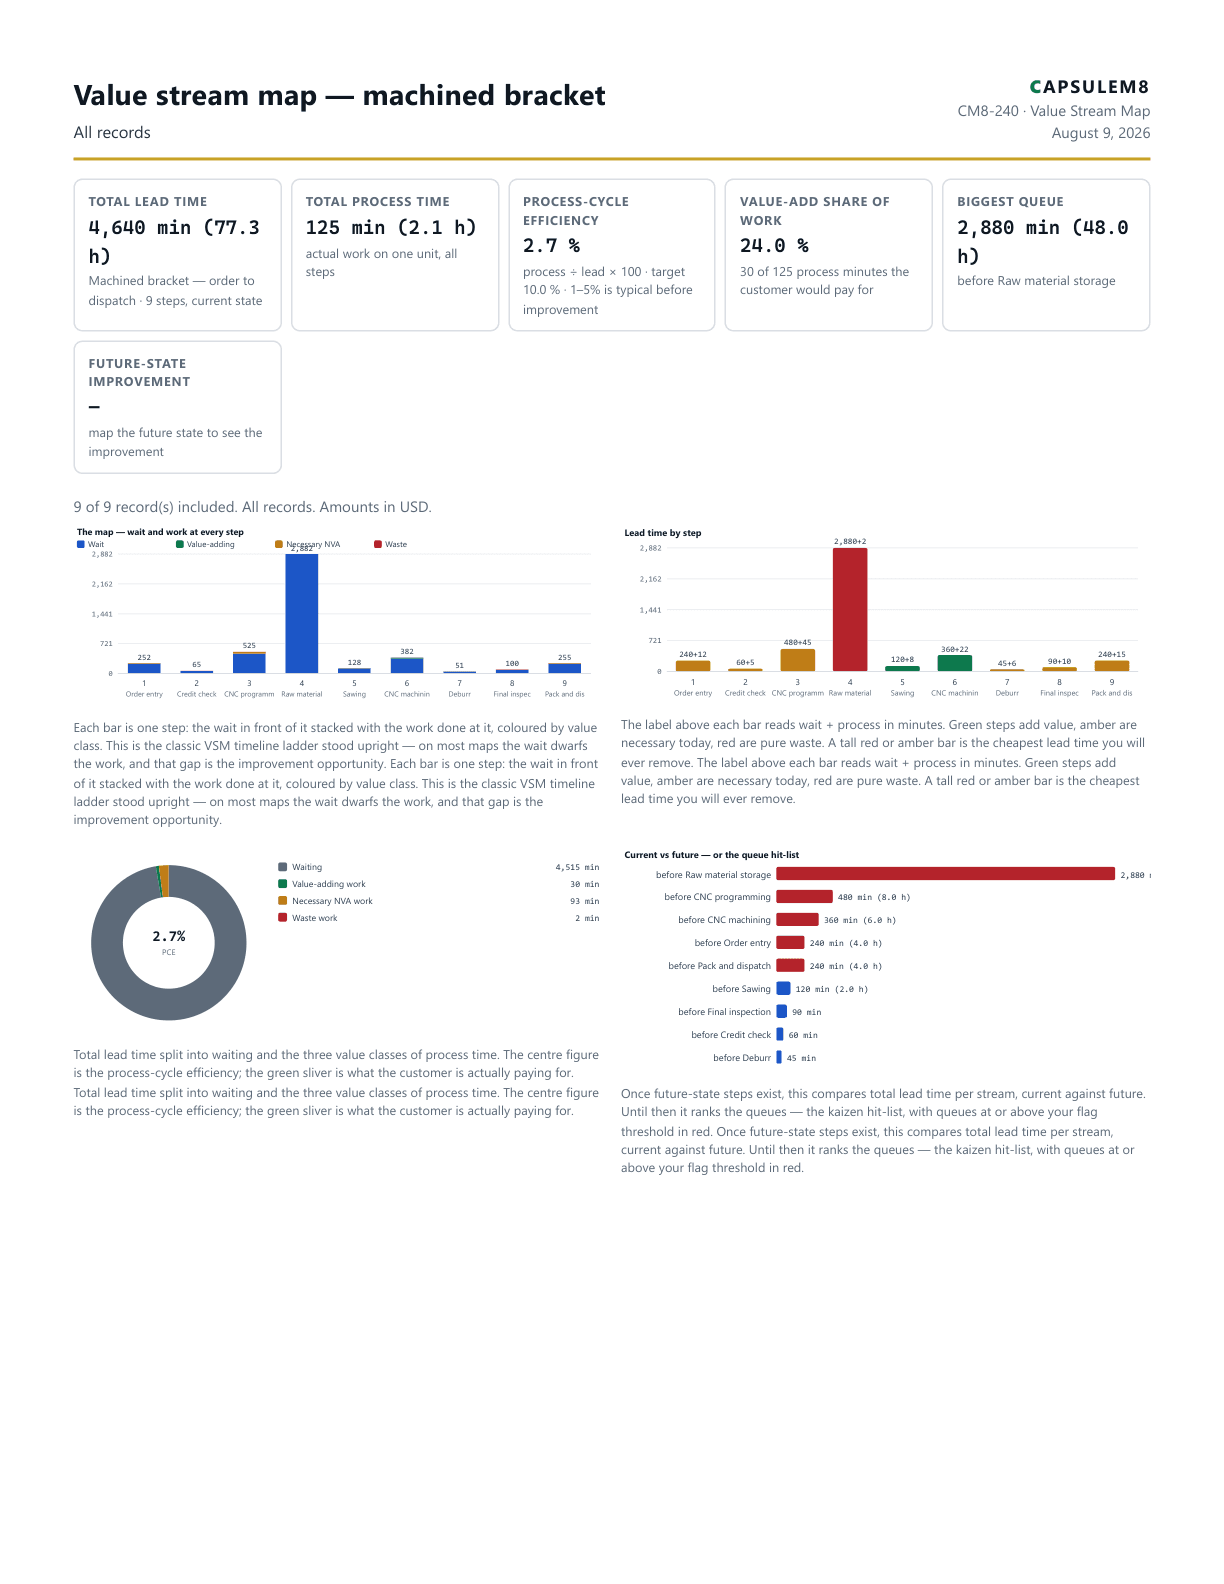
First page of the Value stream map — machined bracket PDF
CM8-240
Manufacturing

Value stream map — machined bracket

Value Stream Map

Map a value stream step by step — process and wait times, value-add analysis, process-cycle efficiency, the biggest queues, and a current-versus-future-state comparison with a printable lean report.

Report detail

Sample map from one walk of the stream — replace every step with your own observed times before relying on it or circulating it.

Records
9
Pages
2
Charts
4
Tables
2

Charts: The map — wait and work at every step, Lead time by step, Where the lead time goes...

Tables: Step detail — current state, Kaizen priorities

PDF 121 KB - v1.0 - reviewed 2026-08-06
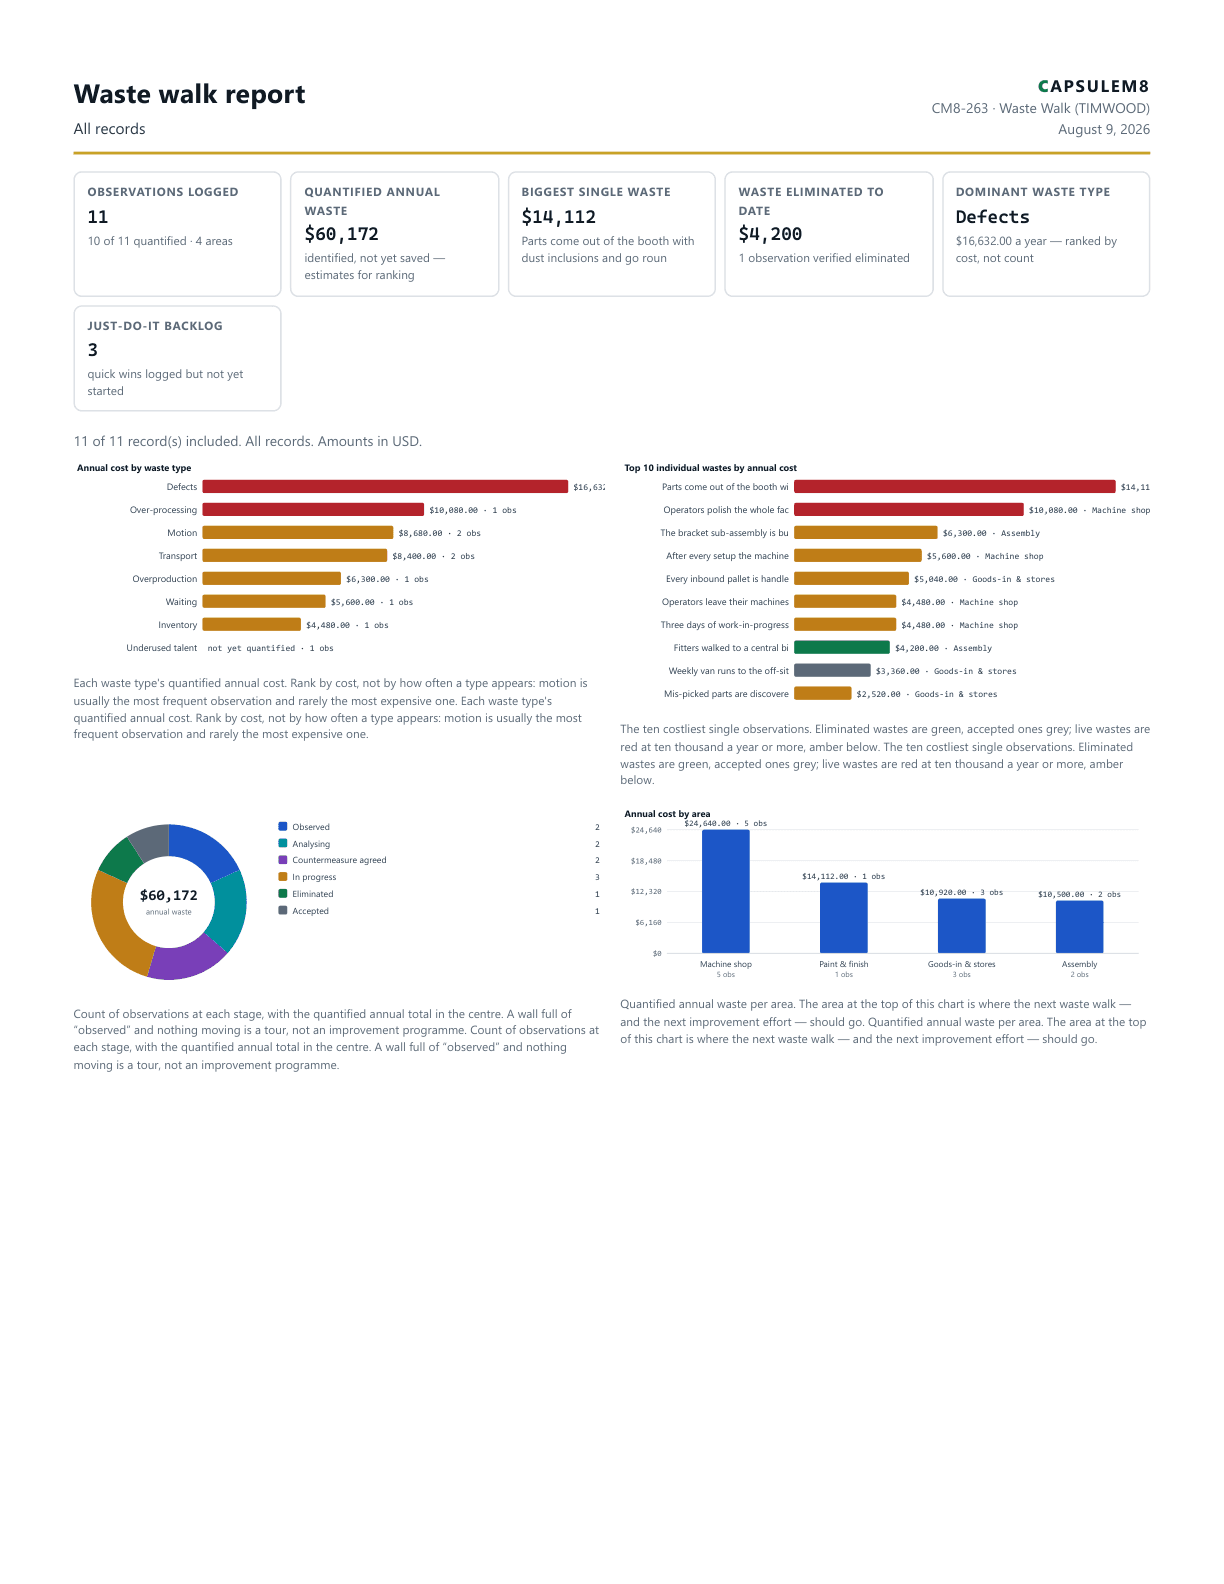
First page of the Waste walk report PDF
CM8-263
Manufacturing

Waste walk report

Waste Walk (TIMWOOD)

Walk the floor, log the seven wastes plus underused talent, put a defensible annual cost on each observation, and print a ranked waste register that shows where the money leaks.

Report detail

Sample walk — replace every observation, rate and occurrence count with your own before relying on the figures or circulating them.

Records
11
Pages
3
Charts
4
Tables
2

Charts: Annual cost by waste type, Top 10 individual wastes by annual cost, Status mix...

Tables: The waste register, Eliminated & accepted

PDF 127 KB - v1.0 - reviewed 2026-08-06