WCapsuleM8
Premium report gallery

See the reports before you choose the tool.

Every PDF here is generated from a real CapsuleM8 premium tool using its built-in sample dataset. Open the report, inspect the charts and tables, then preview or get the tool that produced it.

PDF reports
97
Printable pages
232
Charts shown
388
Summary tables
194

A quick cross-section of board-level, operations, quality, project and supplier reporting outputs.

View premium tools
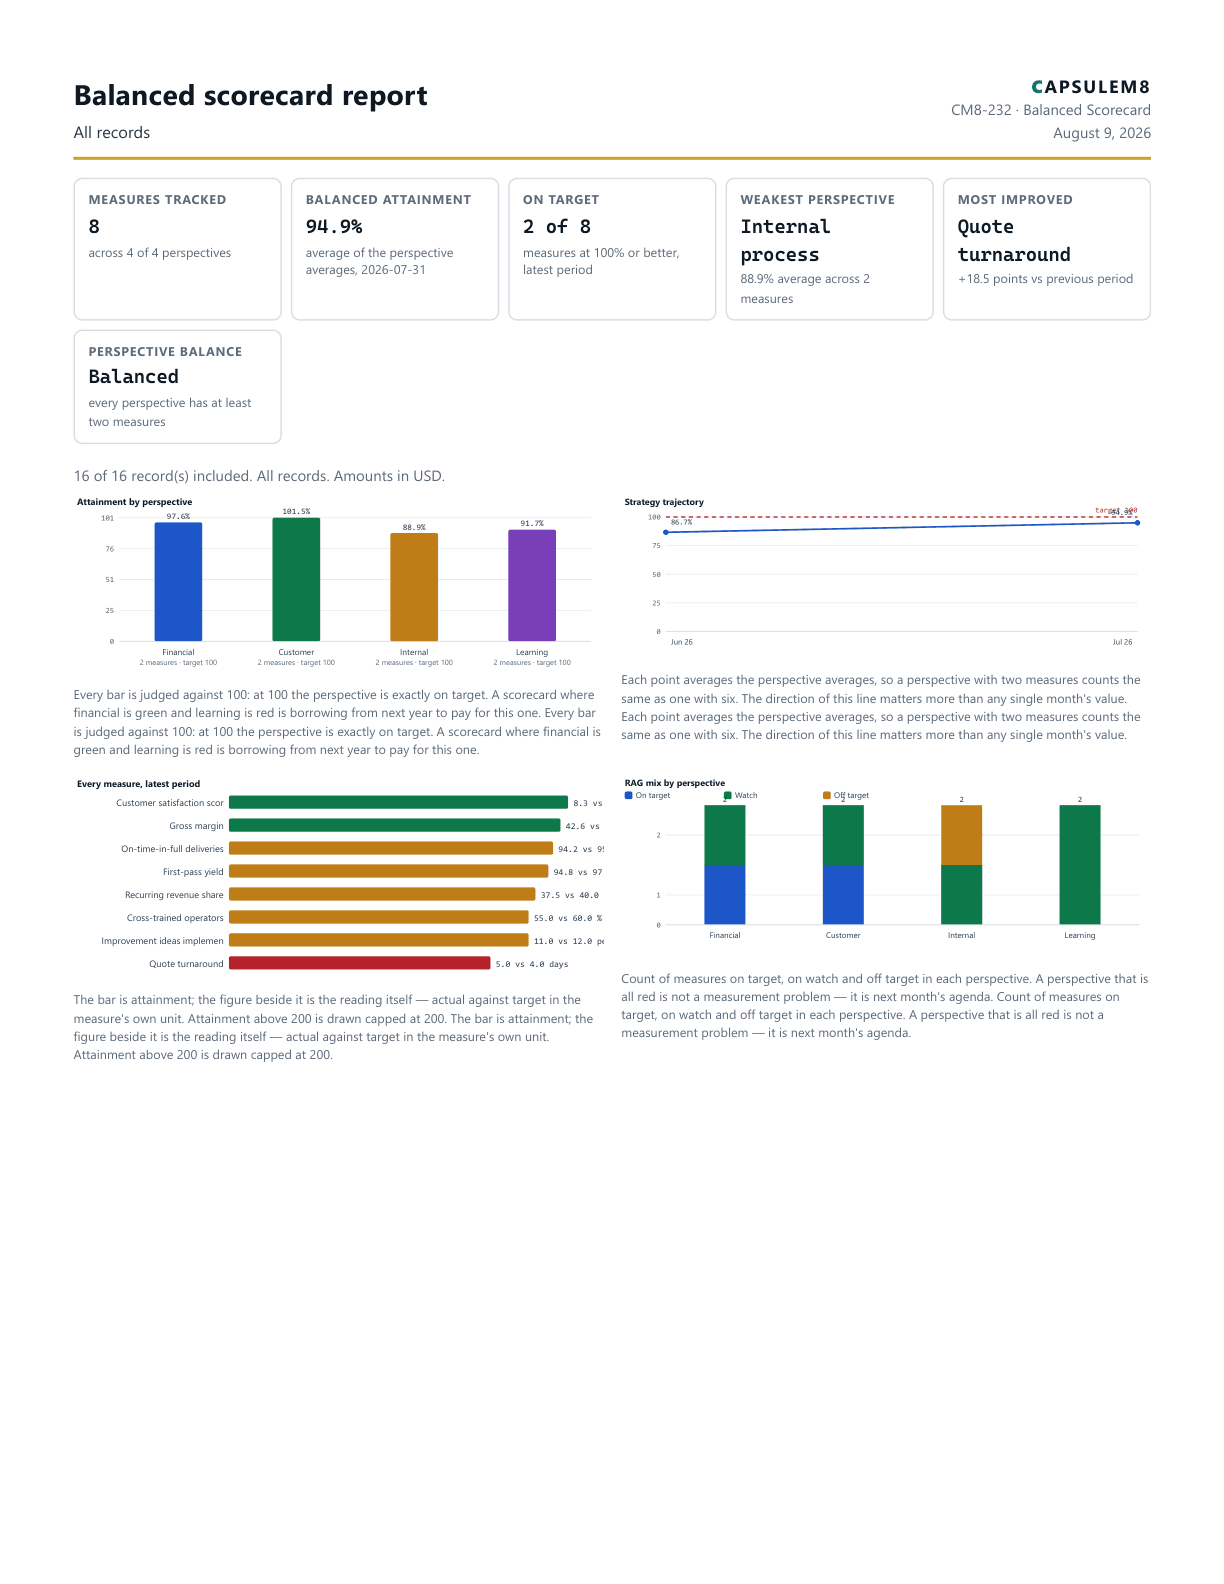
First page of the Balanced scorecard report PDF
CM8-232
Founders and Executives

Balanced scorecard report

Balanced Scorecard

Run a four-perspective balanced scorecard — financial, customer, internal process and learning measures with direction-aware attainment, RAG status, a balance check and a board-ready report.

PDF 116 KB - v1.0 - reviewed 2026-08-06
First page of the Risk register report PDF
CM8-229
Governance and Risk

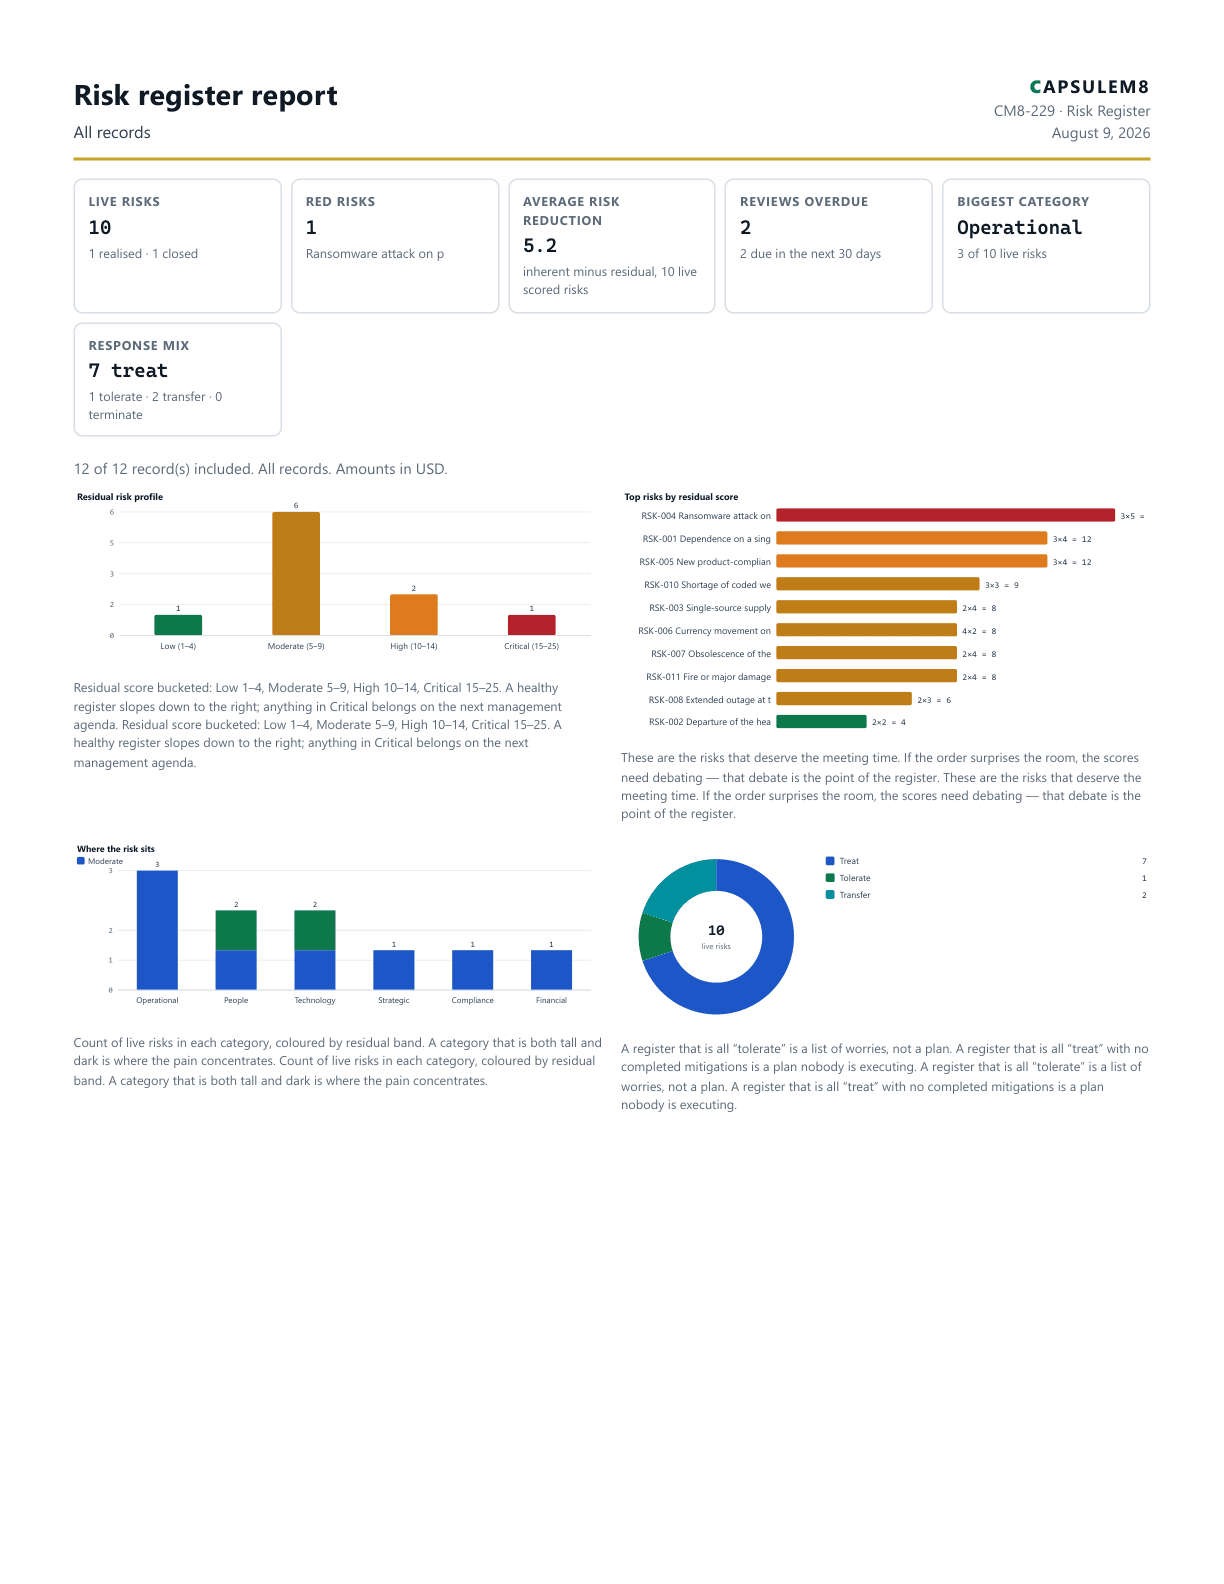
Risk register report

Risk Register

Keep a project and business risk register — strategic, financial, operational and compliance risks scored on a 5×5 grid, inherent and residual, with the four responses and a board-ready report. Not a workplace safety assessment.

PDF 97 KB - v1.0 - reviewed 2026-08-06
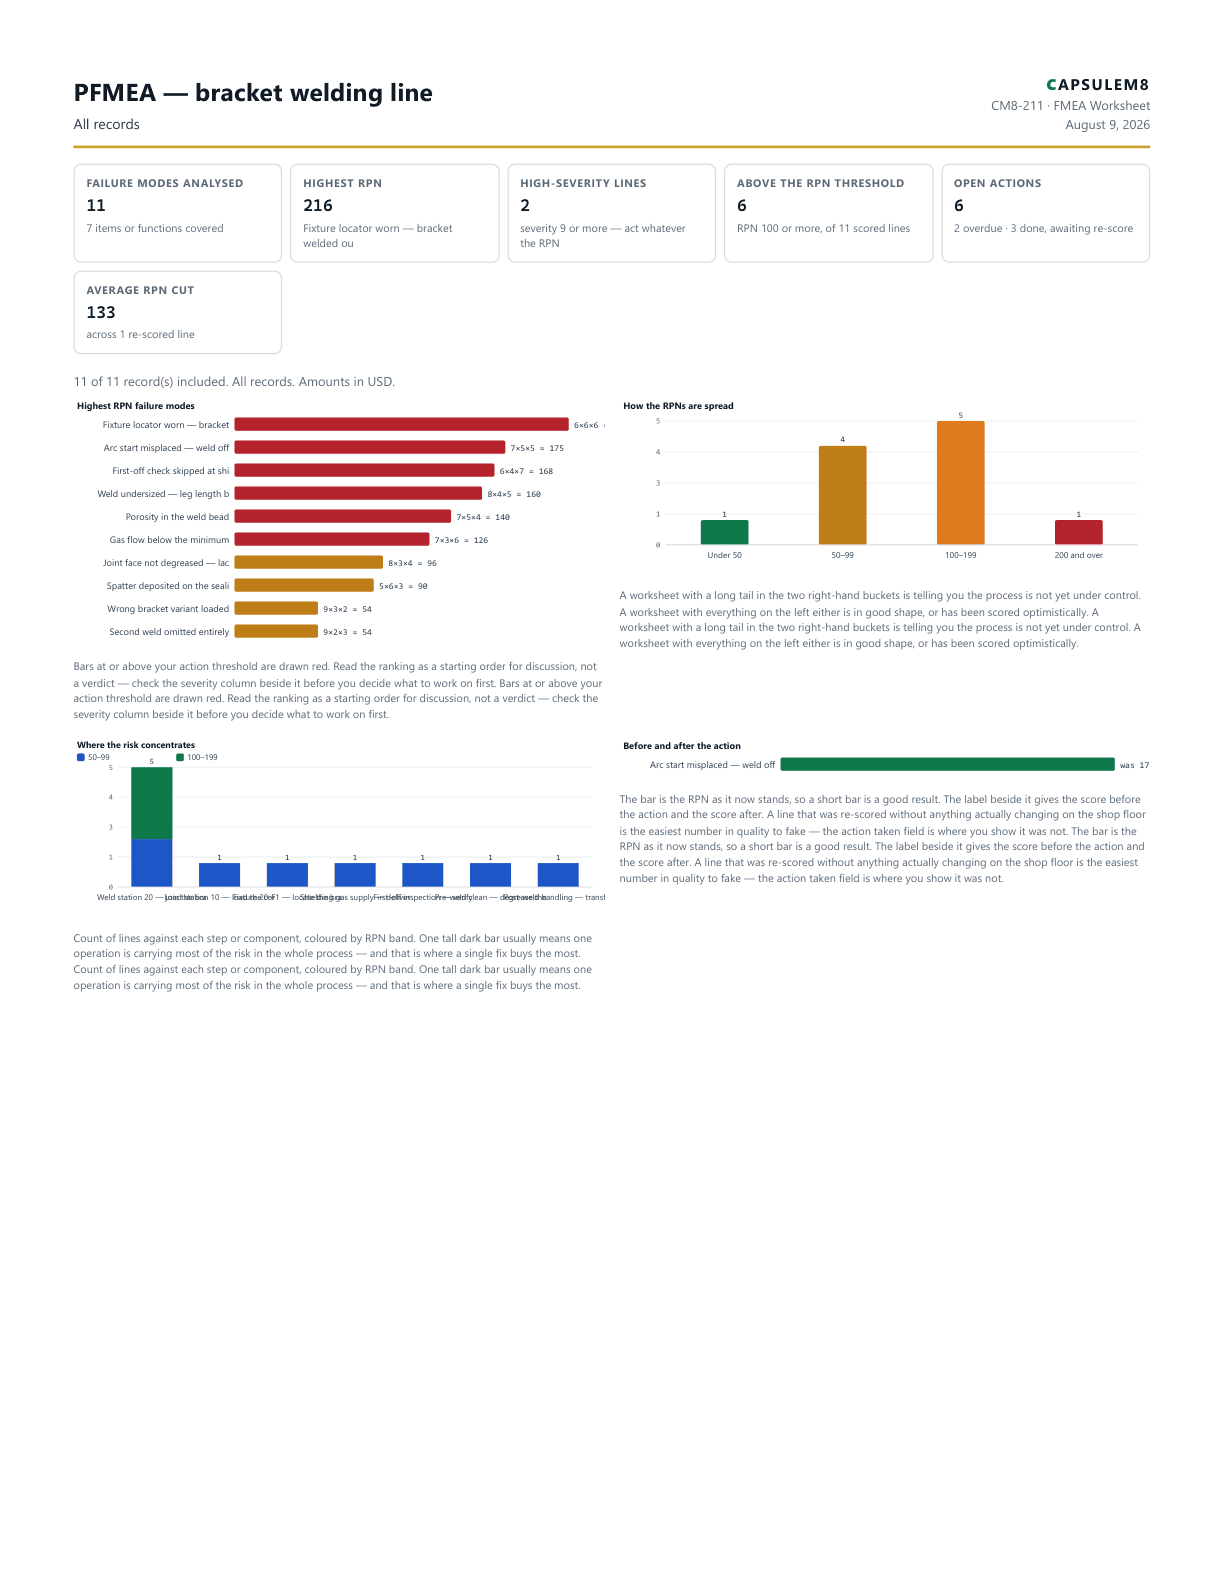
First page of the PFMEA — bracket welding line PDF
CM8-211
Manufacturing

PFMEA — bracket welding line

FMEA Worksheet

Build a PFMEA or DFMEA worksheet — failure modes, effects, severity, occurrence and detection, risk priority number, actions and an honest re-score after the fix, with a printable report. Runs entirely in your browser.

PDF 99 KB - v1.0 - reviewed 2026-08-07

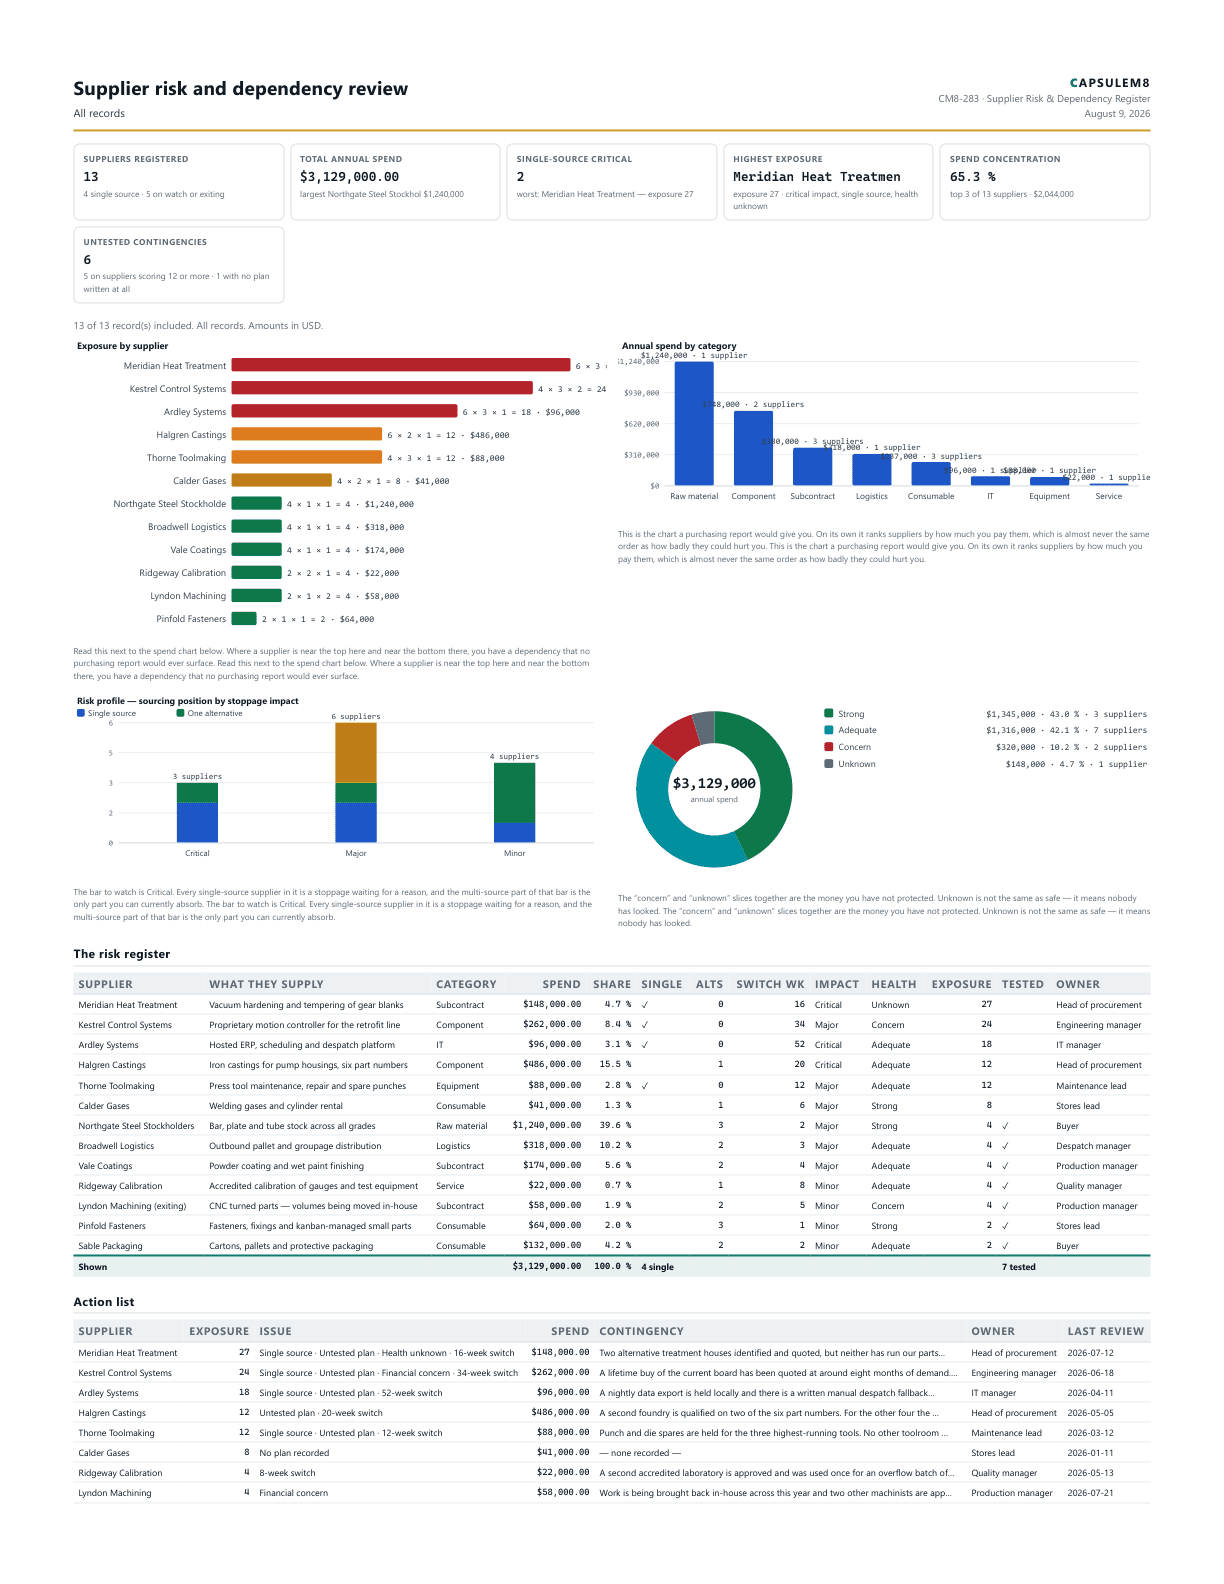
First page of the Supplier risk and dependency review PDF
CM8-283
Operations

Supplier risk and dependency review

Supplier Risk & Dependency Register

Map supply-chain dependency rather than spend: score every supplier for stoppage impact, sourcing position and financial health, expose single-source concentration, and list the suppliers with no tested contingency.

PDF 135 KB - v1.0 - reviewed 2026-08-07

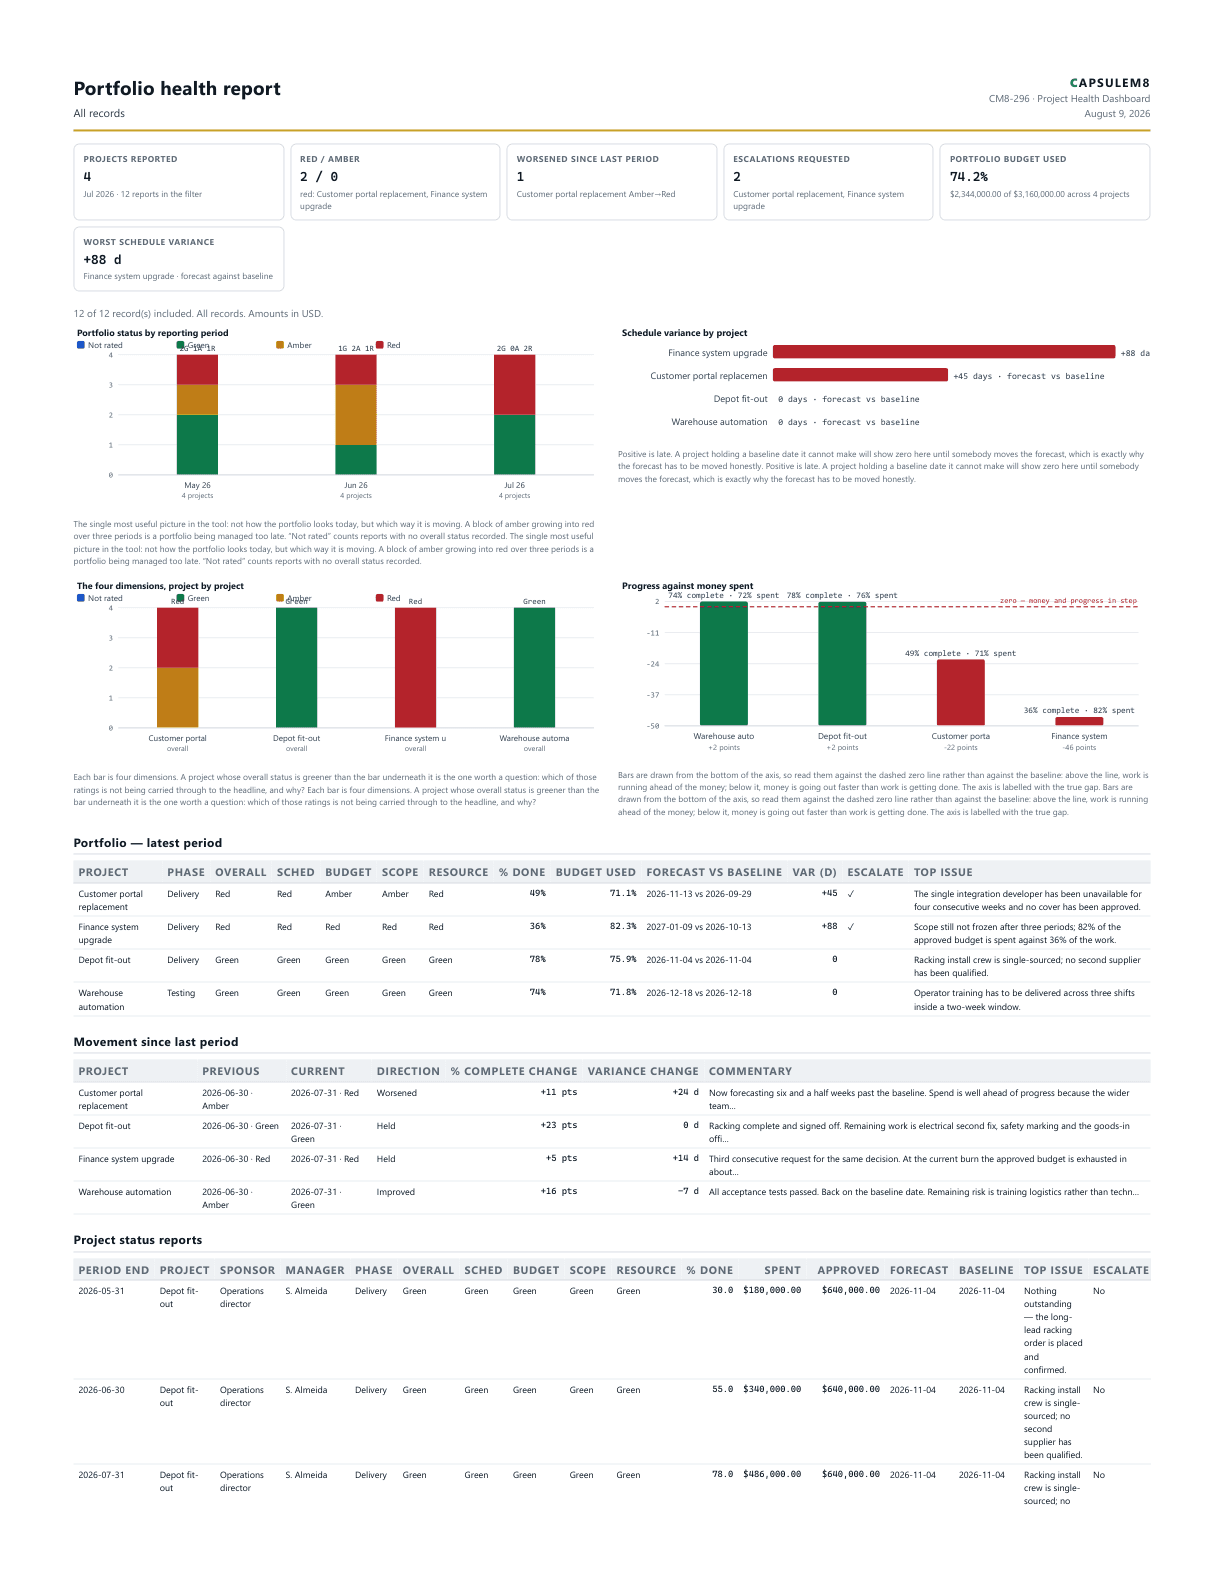
First page of the Portfolio health report PDF
CM8-296
Project Management

Portfolio health report

Project Health Dashboard

Report a portfolio of projects period by period — red, amber and green status across schedule, budget, scope and resource, spend against progress, forecast against baseline finish, and which projects worsened since last month. Runs entirely in your browser.

PDF 104 KB - v1.0 - reviewed 2026-08-07

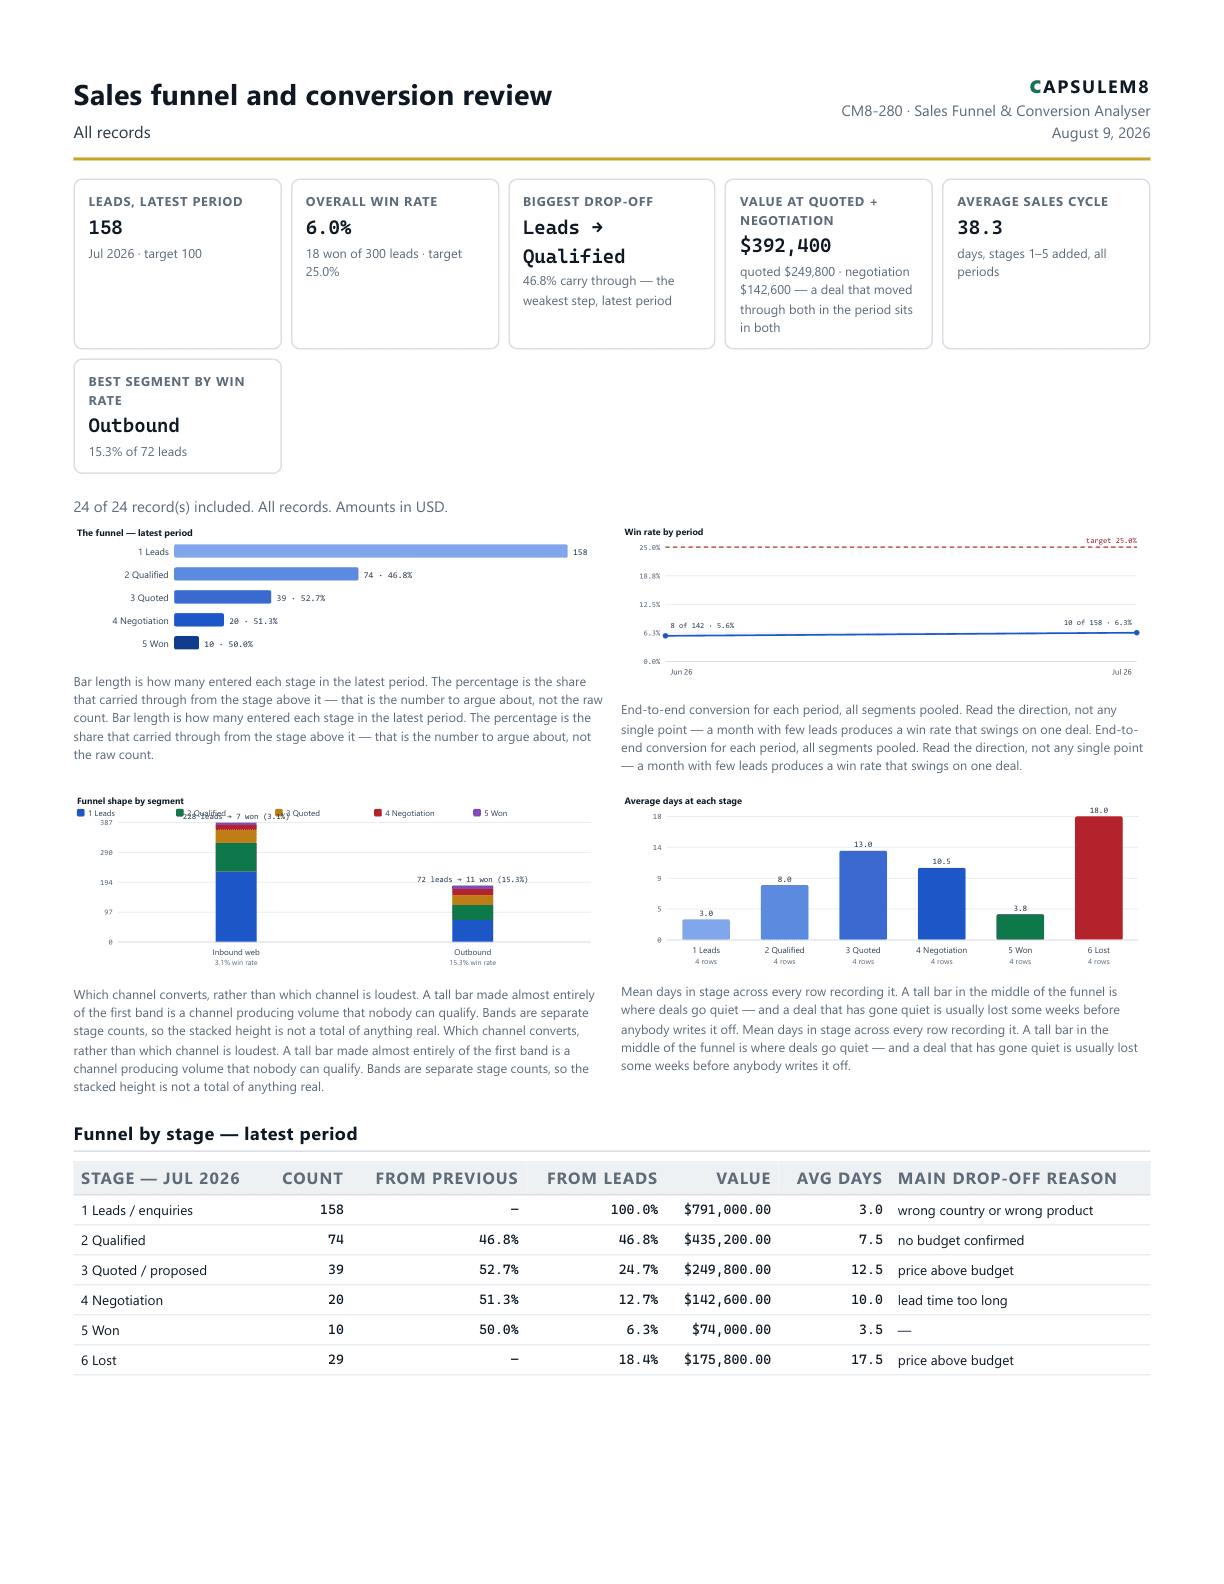
First page of the Sales funnel and conversion review PDF
CM8-280
Sales

Sales funnel and conversion review

Sales Funnel & Conversion Analyser

Measure stage-to-stage conversion in your sales funnel — where enquiries drop out, which channel actually converts, the average days deals sit at each stage, and how many leads a win target really needs. A funnel analyser, not an opportunity-by-opportunity pipeline list.

PDF 118 KB - v1.0 - reviewed 2026-08-07

What each report contains

The report is not a screenshot bolted onto a form. It is a printable management output: scope, summary, charts, tables, source rows, notes and the tool disclaimer in one PDF.

Executive summary

KPI tiles put the position on the first page: totals, exceptions, trends and the one number worth discussing.

Chart narrative

Charts include visible values and captions, so the report explains what changed rather than just drawing a picture.

Decision tables

The printed tables carry the ranked risks, open actions, overdue items or comparison rows that make the report auditable.

Professional metadata

The PDF title, subject, author, keywords, creator and review date are stamped from the tool specification.

How to read these samples

At a high level, look at the first row of tiles, then the first chart. That tells you whether the tool produces the kind of management conversation you need: risk, capacity, cost, delivery, compliance, quality or performance.

At detail level, inspect the tables and notes. Each sample report uses realistic rows from the tool specification, keeps the source register in the printed output where it matters, and includes the report scope so filtered and unfiltered numbers are not confused.

All report examples

4 of 97 report PDFs shown in Facilities and Maintenance.

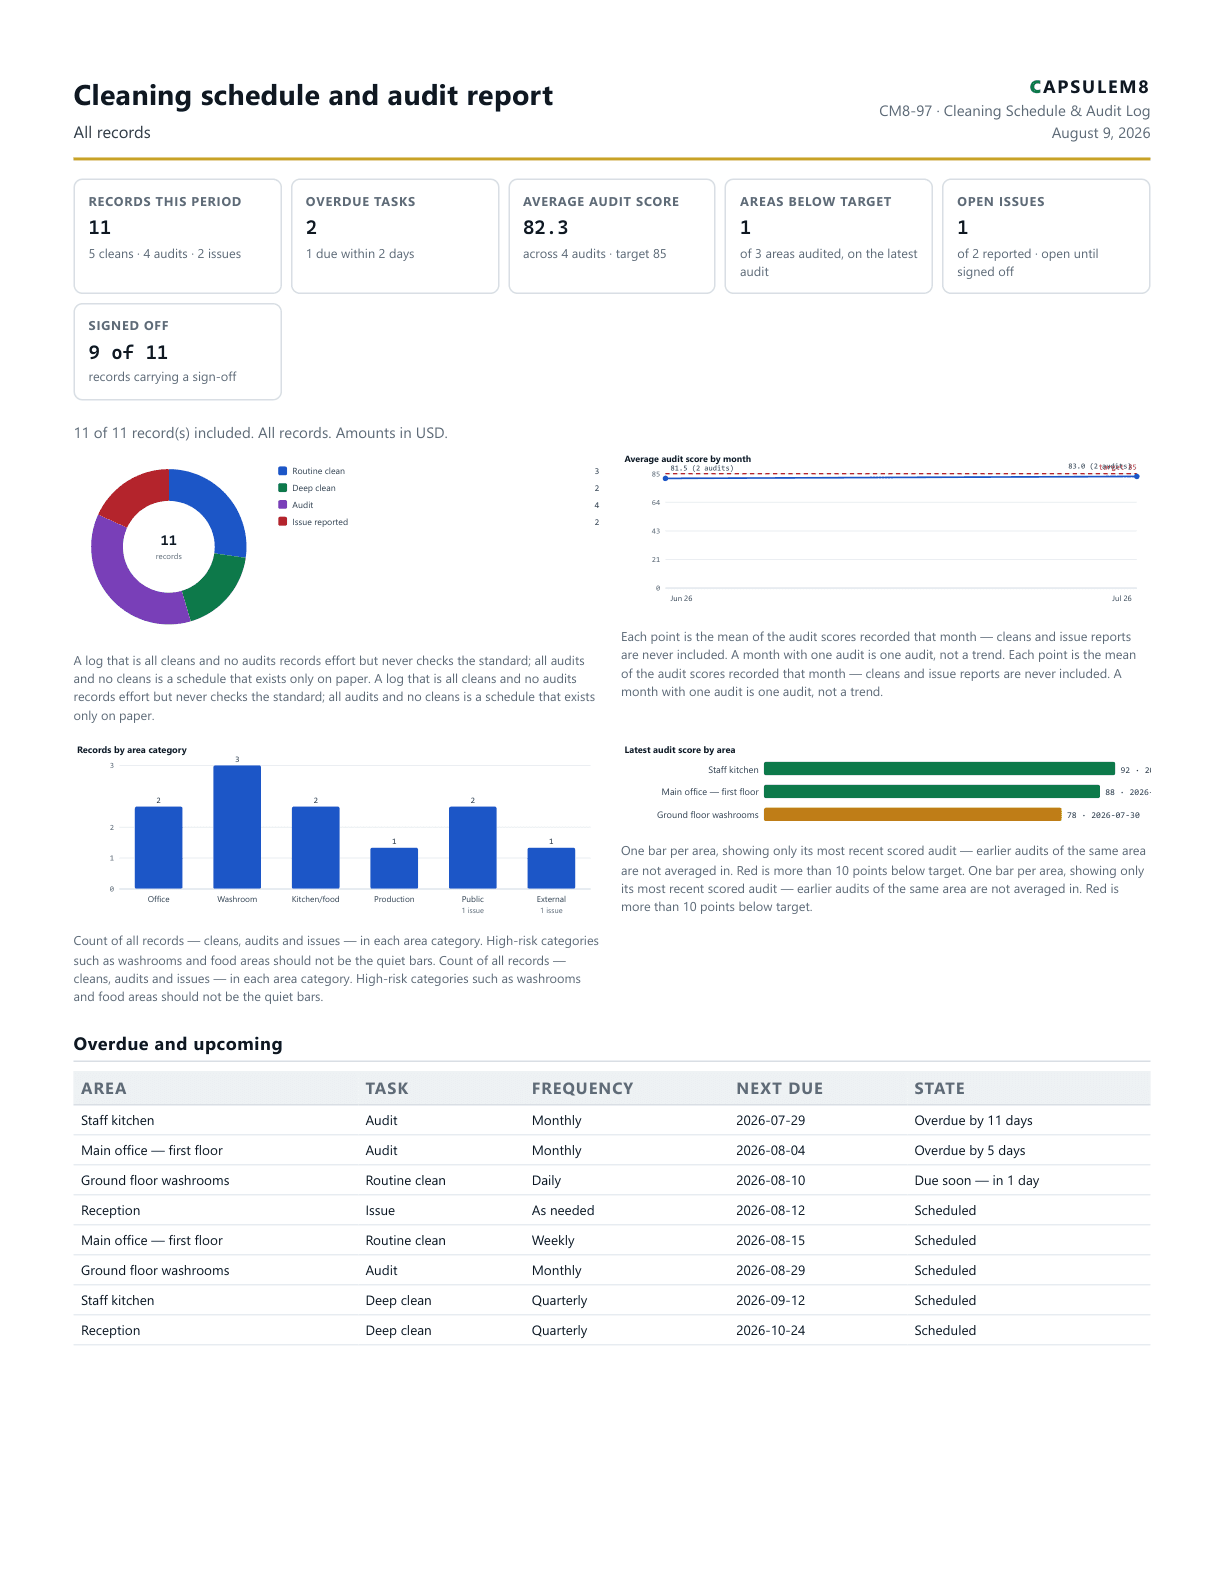
First page of the Cleaning schedule and audit report PDF
CM8-97
Facilities and Maintenance

Cleaning schedule and audit report

Cleaning Schedule & Audit Log

Log cleaning tasks and periodic audits with scores, see which areas fall below your audit target, catch overdue tasks before a visitor does, and print an audit-ready report. Runs entirely in your browser —

Report detail

Sample log — replace every entry with your own before relying on it or circulating it.

Records
11
Pages
2
Charts
4
Tables
2

Charts: Records by type, Average audit score by month, Records by area category...

Tables: Overdue and upcoming, Per-area summary

PDF 102 KB - v1.0 - reviewed 2026-08-05

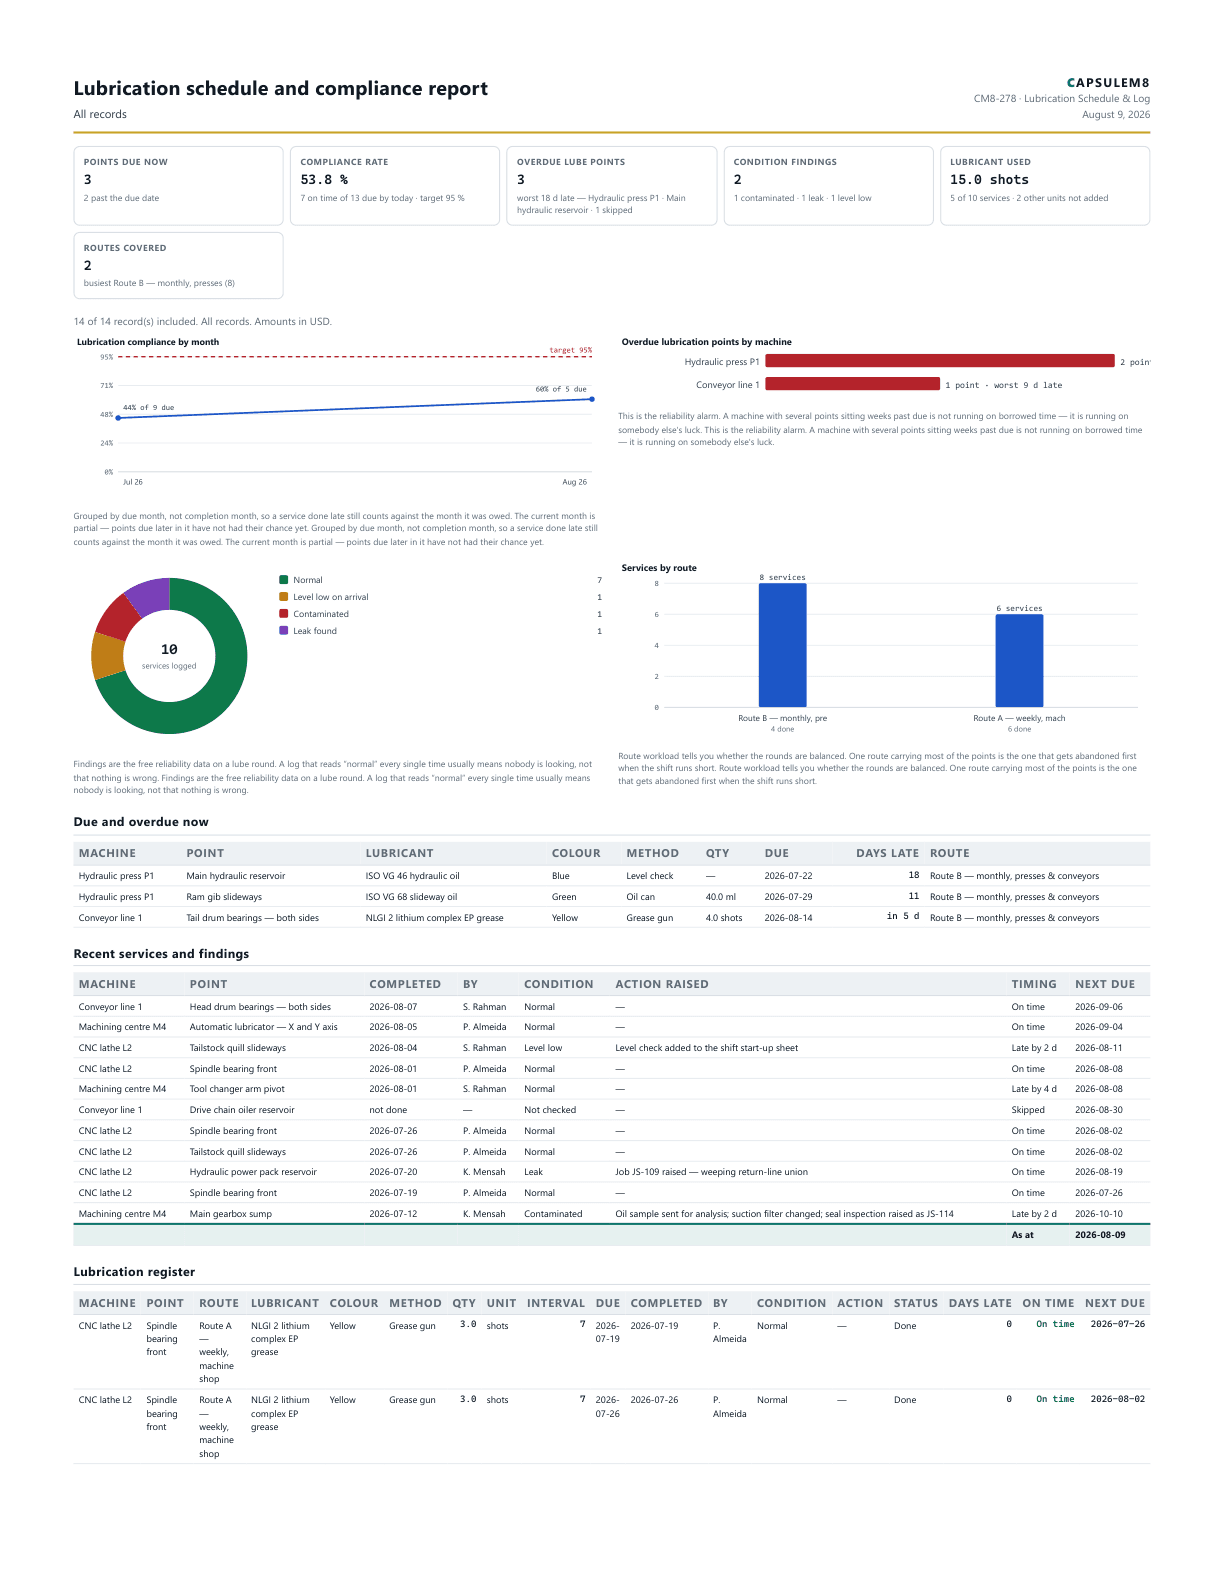
First page of the Lubrication schedule and compliance report PDF
CM8-278
Facilities and Maintenance

Lubrication schedule and compliance report

Lubrication Schedule & Log

Plan and record greasing and oiling by lubrication point and route — intervals, due dates, colour codes, quantities, condition findings and a compliance rate you can defend. Runs entirely in your browser.

Report detail

Sample schedule — replace every point, lubricant, quantity and interval with the figures from your own equipment documentation before relying on it.

Records
14
Pages
2
Charts
4
Tables
2

Charts: Lubrication compliance by month, Overdue lubrication points by machine, What people found at the point...

Tables: Due and overdue now, Recent services and findings

PDF 116 KB - v1.0 - reviewed 2026-08-07

First page of the Machine history and reliability record PDF
CM8-279
Facilities and Maintenance

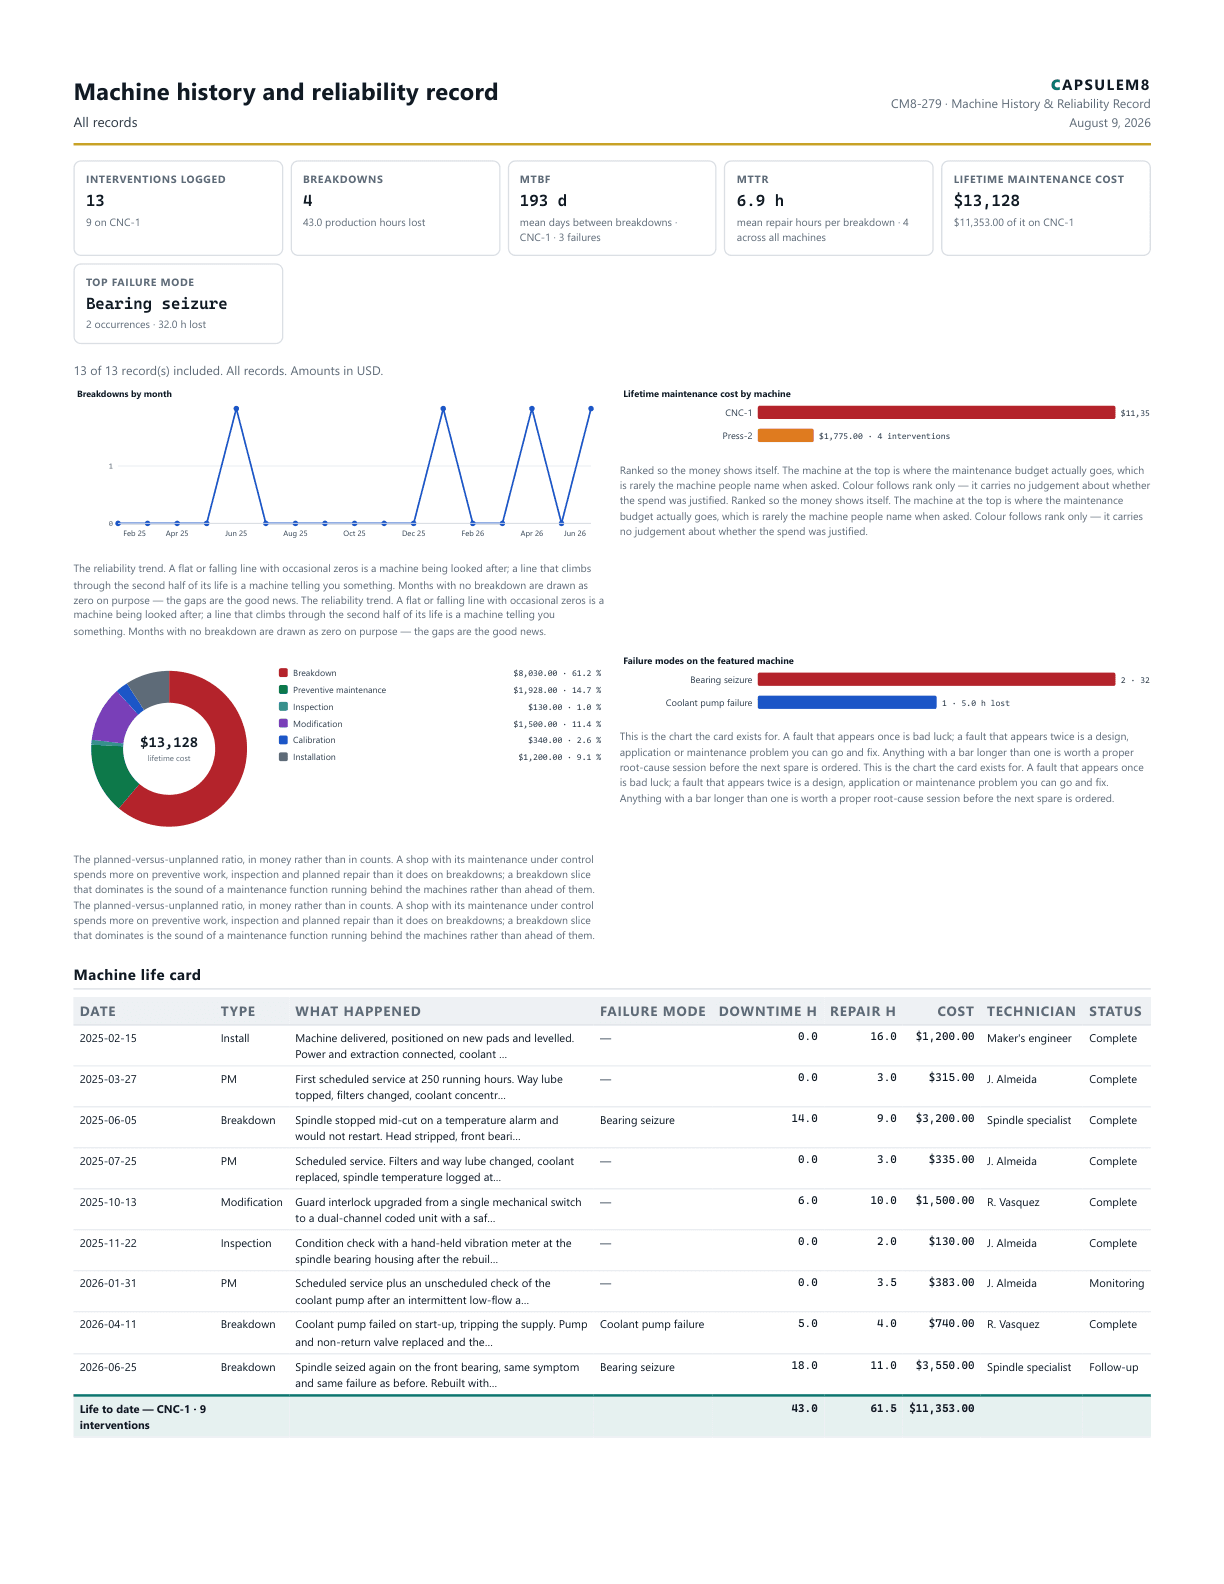
Machine history and reliability record

Machine History & Reliability Record

Keep the life history of every machine — one line per intervention, from commissioning to overhaul — and read the reliability out of it: mean time between failures, mean time to repair, repeating failure modes and lifetime maintenance cost against replacement.

Report detail

Sample history — two machines over roughly eighteen months, loaded to show the calculations working. Replace every entry with your own before relying on it or circulating it.

Records
13
Pages
2
Charts
4
Tables
2

Charts: Breakdowns by month, Lifetime maintenance cost by machine, Where the maintenance money goes...

Tables: Machine life card, Reliability summary by machine

PDF 127 KB - v1.0 - reviewed 2026-08-07

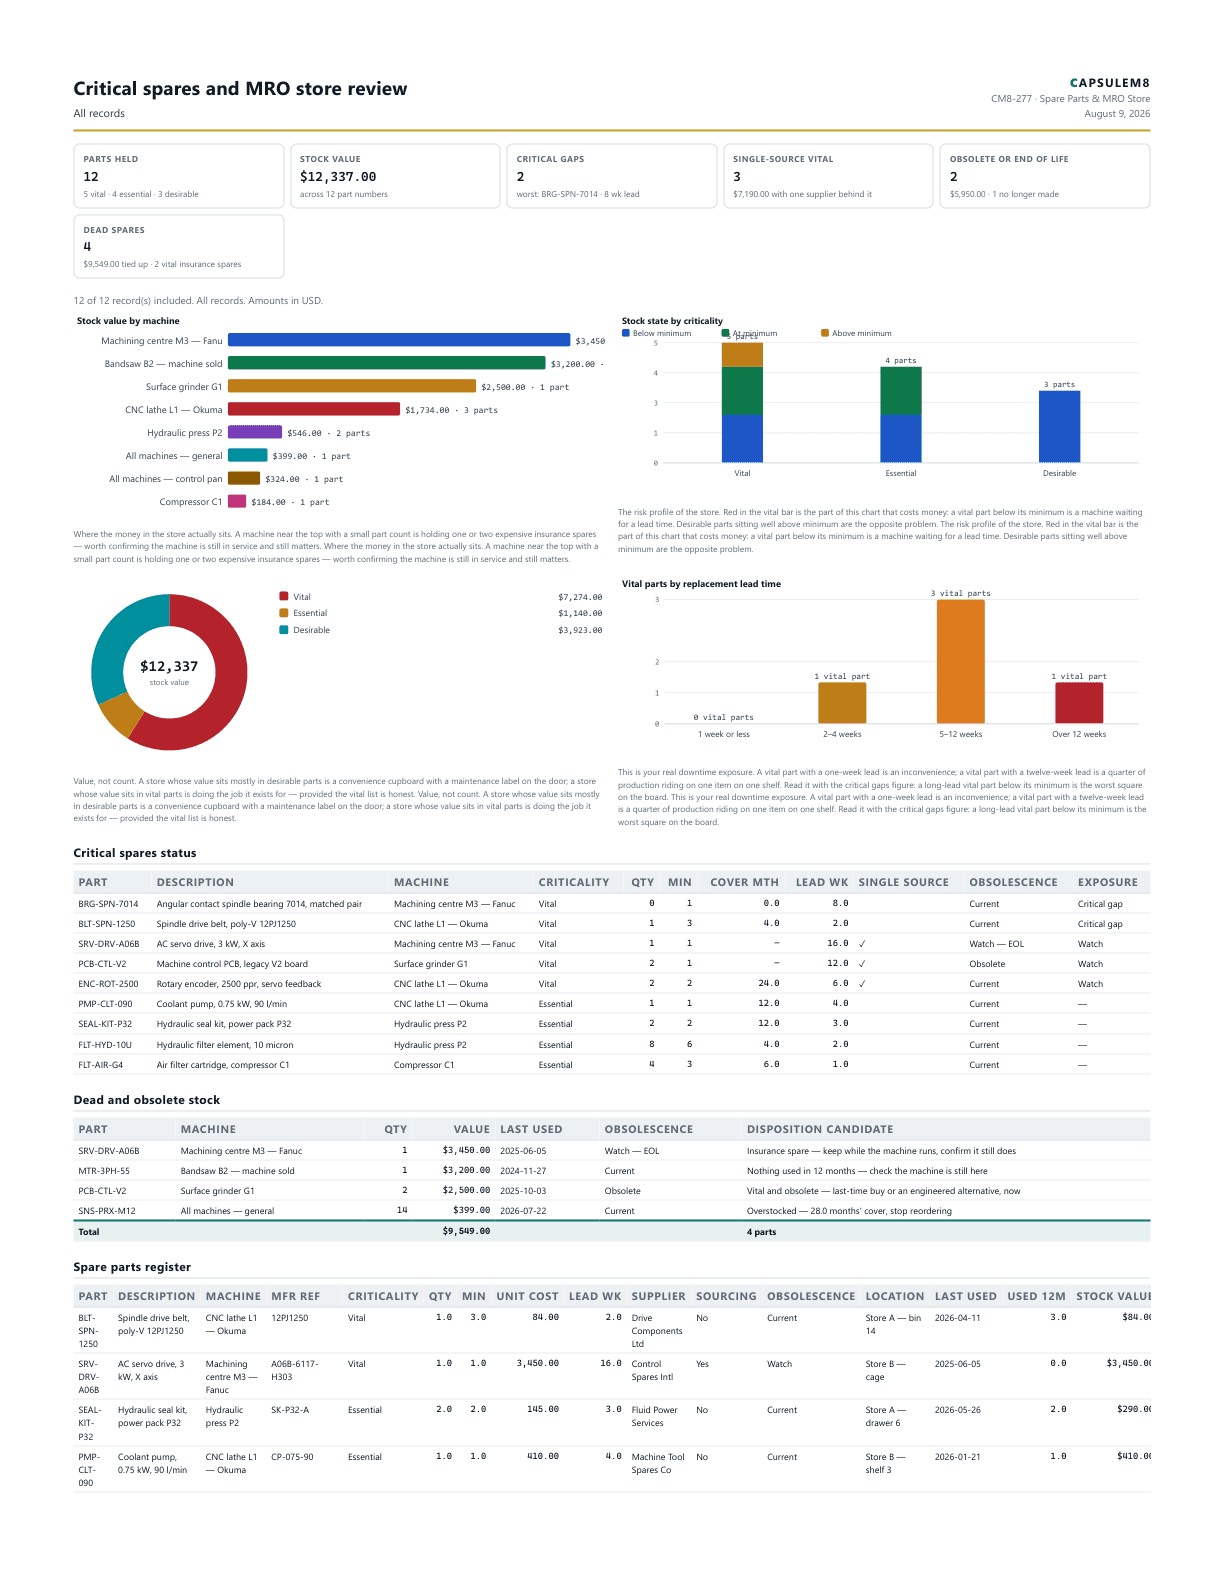
First page of the Critical spares and MRO store review PDF
CM8-277
Facilities and Maintenance

Critical spares and MRO store review

Spare Parts & MRO Store

Keep a critical spares and MRO store register — every part linked to the machine it fits, classified vital, essential or desirable, with minimum stock, lead time, single-source and obsolescence risk, cover months and a dead-stock list.

Report detail

Sample store — a small machine shop with five production assets. Two vital parts sit below their minimum, one of them at zero with an eight-week lead. Three vital parts depend on a single supplier and one of those is no longer manufactured. Replace every line with your own before relying on this or circulating it.

Records
12
Pages
2
Charts
4
Tables
2

Charts: Stock value by machine, Stock state by criticality, Stock value by criticality...

Tables: Critical spares status, Dead and obsolete stock

PDF 115 KB - v1.0 - reviewed 2026-08-07